
-
Who's Online 11 Members, 1 Anonymous, 75 Guests (See full list)
-
Popular Contributors
-
1

-
2
-
3

-
4
-
5

-
-
Activity Stream
-
1805
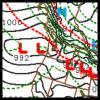
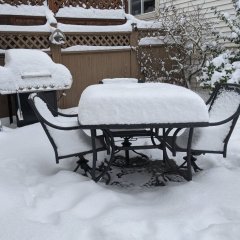
April 2024 Weather in the PNW
ECMWF also shows Sunday fairly sunny and around 60 at SEA so not a bad after the crash. -
1805
April 2024 Weather in the PNW
ECMWF shows 71 to 58 at SEA between 2 p.m. and 5 p.m. -
1805
April 2024 Weather in the PNW
GFS shows one of the most impressive daytime temp crashes I've ever seen tomorrow. From 71 at 2pm to 49 at 5pm in Tacoma. -
-
1805
April 2024 Weather in the PNW
He says drier in the West but that is not a problem because that area needs to dry out a bit.- 1
-

-


Recommended Posts
Join the conversation
You can post now and register later. If you have an account, sign in now to post with your account.