
Leaderboard


Popular Content
Showing content with the highest reputation on 09/12/16 in all areas
-
I think the only supported conclusion(s) we can reach right now are: 1) Blocking is favored to develop over the NPAC by/during November. 2) Polar blocking (-NAM/-NAO et al) is favored to reach maximum strength during January. 3) While all months show potential for Arctic intrusion for Arctic intrusion into the PNW, the months of November/December and/or February look to hold the strongest signal, while January and March hold a less impressive signal. 4) We'll know by November if winter 2016-17 is following this historical guide, or whether the system goes a different route. If the winter fails, it will probably be due to a strong +EPO/Western-Arctic Vortex pattern.3 points
-
Thanks Chris; that's the conclusion I have as well. The 10C/18F temperature change for similar altitudes in New England vs. Mt Rainier just wouldn't be enough to compensate for the altitude. That would mean that the temperature change between 6288 feet and 14,411 feet would have to be less than 18F, which is unlikely. Anyway, it was an interesting discussion if even if it got out of hand at times. I have to say that even though indications are that Rainier is a little colder in winter, comparing the winter temperatures on Rainier vs. Mt Washington to me actually makes Mt. Washington more impressive, not less. All indications I have say that winter temperatures on Mt Washington (6288 feet) are equivalent to about 13,000 feet on Mt Rainier. This is very impressive since Mt Washington is less than half that elevation. It also means that Mt Washington is colder in winter than all other Cascade Peaks, besides Rainier. It must also be mentioned that even if Rainier is as windy as Mount Washington, that a 100 mph wind (or any other speed) has a lot more force at 6288 feet than it would at 14,411 feet. Anyway, I guess I have to accept some responsibility for starting the debate since it was my webpage that seems to have started it. When I created it, I never knew that it would start such a debate. That said, my two biggest hobbies are weather and mountains, so discussing mountain weather combines both of them. I love weather mountain statistics and have climbed more than 2000 mountains and always pay attention to the weather conditions. And just for fun, here's a photo of me shielding my face from the cold from a -85F windchill on the old chart (a less impressive -58F on the new chart): http://www.summitpost.org/images/medium/40311.jpg I'm in the mountains in all kinds of weather. I wonder how the data I provided on Mt Rainier compares with the proxy data? It will be interesting to compare. Anyway, back to the most interesting topic of Peter Sinks!3 points
-
If you were Jim, Tim would be warning you about using such words.2 points
-
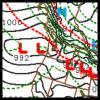
Looks like you have a strong northerly gradient down there.1 point
-
Incidentally...the 30 day SOI is over +8 now and the OLR 5N to 5S / 160W to 160E is positive. Pretty good signs the Nina is going to be just fine. The current trade wind burst should really beef it up over the next week.1 point
-
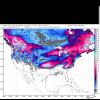
00z CMC ensemble mean @ d10. http://i724.photobucket.com/albums/ww243/phillywillie/Mobile%20Uploads/C3F54226-14F7-424D-8438-0328CE8A5F71_zpsr4ku2jw0.png1 point
-
You sound like Rob now during an east wind event. lol1 point
-
You got that right1 point
-
I deleted a lot of the mean posts, but left posts of value for future readers as there was a lot of good stuff in there.1 point
-
I like what you've done with the subarctic/subpolar climate. Specifically how you added the -7C isotherm to differentiate between continental subarctic climates and the maritime-influence version. I feel that the subarctic category is too broad under the Koppen system. A location with an average January temperature of -3C should not be classified under the same climate zone as a location that averages -30C (although they may subgrouped by precipitation). There is a Dfd/Dwd subtype that can be found in the colder areas of the Siberian interior, but it doesn't come into play unless the coldest month averages significantly colder (I believe -38C).1 point
-
I remember researching the Juniper Lake reading a few years ago. I determined its not legit based on a lack of corroborating readings and the station's history. The real state record low for May is probably the 4F at Fremont on May 1, 1954.1 point
-
Personally, I don't think that the 0F at Juniper Lake on May 2 1968 is legit. The high at Juniper Lake that day supposedly was 81F. If that is legit, it must be either the or one of the greatest diurnal temperature changes ever to occur in the country, or at least the greatest that I am aware of. Looking at the WRCC data though, it appears that the reading may not be legit. The WRCC data gives a record low of 25F for May 2, recorded in 1967. If the 0F is legit, then the May record low is colder than the record low for November. It would also make it the coldest temperature at that location recorded anytime between March 1 and December 11. None of the other nearby weather stations have gotten even close to that cold in May either (actually none of the nearby stations have even gotten that cold in April, or even that close to 0F in April). Those stats paired with the reported high of 81F that day, would mean that it would have to be one of the most freak instances of a 0F ever recorded.1 point
-
Looking for some straight forward answers or links if possible. The "blob" obviously is being talked about again, and I want to know if it really does influence our climate in any way? The SST's in that area are simply a reflection of the upper level circulations, which in this case is high pressure resulting in less mixing of the waters. Does this truly alter the airmass enough to make a difference? Most of the blob is hype, and the "so much for winter" posts on FB are exaggerated (even if they are being serious), but I'm honestly curious. I'm assuming any type of warming, if any, would be isolated to the coastline? Thanks!1 point
-
I am not convinced that this winter will be a fail. I think there is a chance we could see some decent winter weather.1 point
-
Let's examine a case: Portland, OR Things to consider: Annual mean tempMean temp of warmest monthMean temp of coldest monthAnnual precipWettest and driest month precipAnnual thermal amplitudePercent difference between wettest and driest monthFor Portland: Annual mean temp: 12.4c Mean temp warmest month: 20.8c Mean temp coldest month: 4.7c Annual precip: 914 mm Wettest month: 143 mm Driest month: 17 mm Annual thermal amplitude: 16.2c Difference between wettest and driest month: 8.4 (wettest month is 840% wetter than driest month) Let's figure out the climate zone of Portland based on the proposed classification system: 1. Warmest month is below 22c so Portland is not subtropical under this system. Portland also has only 7 months > 10c (subtropical criteria is 8 months > 10c) 2. Portland meets the temperate requirements (>= 4 months > 10c and annual temp >= 3c) 3. Portland also meets the initial definition for subpolar (at least one month >= 10c) but it fails to meet the requirement that coldest month <= 0c, so it is not subpolar. Portland is temperate (D) as the primary classification Figuring out the secondary classification: 4. Coldest month > 0c so we can rule out Do, Dn, Dc 5. Annual precipitation > 400 mm so we can rule out Dq 6. Annual amplitude > 15c (16.2c) and coldest month < 5c (4.6c) so Portland seems to be temperate semi-continental (Dt) though it is close to being temperate maritime. We can add other specific classifications for temp/precip: Annual temp > 10c (warm): w Annual precip > 800 mm (humid): h Wettest month > 3x wetter than driest month with dry season in summer: s Final classification becomes Dt(whs) or temperate semi-continental warm humid dry summer1 point
-
Poor 1997-98 just isn't as special as it used to be.1 point
-
And here I just bought brand new tires for both my truck and wife's SUV for what I was hoping would be a decent winter for the first time since 2011/ 2012. Perhaps if I did zero winter prep we would have a good one again. Last time I was caught off guard and was not ready for winter weather was Nov 2006, that was epic. Think I will just leave the nearly bald tires on...that will do it!!1 point
-
What? It's still summer. Late summer, when the lows can get quite a bit cooler than mid summer.1 point
-
But that was the St. Louis Rams! This is totally different.1 point
-
I'll try to find some maps sometime today or tomorrow. I believe there are some significant differences even among enso types but I'm not sure how they work. Some pretty compelling evidence for why we don't want a -qbo would be seen in February as the Nino was dying out really rapidly. All the cold that came down in late winter got shoved off the east coast while the rest of the country baked. Textbook in my opinion. It also contributed directly to the ++AO all winter.1 point
-
My thoughts as a meteorologist after reading this thread: * Mt Rainier is probably colder on average than Mt Washington (summit of both) in the winter (DJF) and annualized timeframes. * I think it's tough to say which has a higher mean wind speed (though with a typically stronger jet Mt Washington probably sees higher absolute wind speeds than Rainier). Let's examine H7 and H5 windspeeds (annual mean) Rainier proxies: UIL (1966-2014): 21 kts (H7), 34 kts (H5) SLE (1956-2014): 21 kts (H7), 34 kts (H5) Washington proxies: PWM and GYX (1948-2014): 18 kts (H8), 27 kts (H7), 41 kts (H5) ALB (1948-2014): 20 kts (H8), 28 kts (H7), 41 kts (H5) Summit of Mt Washington is 6,288' or about 800 mb. Summit of Rainier is 14,411' or about 590 mb (~600 mb). H8, H7 and H5 annual mean temps at the same locations (deg C): UIL: 3, -4, -19 SLE: 5, -2, -18 PWM/GYX: 2, -4, -19 ALB: 3, -3, -18 700 mb and 500 mb temps are pretty similar, annualized, at both Washington and Rainier meaning Rainier's summit is certainly colder than Mt Washington on average. Wind speeds are tough to predict at Rainier as the summit is higher (expected higher winds) but broader (more surface friction at summit level versus a smaller summit area like Washington), so I can't say for certain which has stronger mean winds. I wouldn't be surprised if Rainier averaged lower on its summit (Columbia Crest), but potentially a location near the edge of the summit like Liberty Cap could average higher than Mt Washington. Winds on the windward aspects of the summit are likely stronger than those on the summit itself and on the leeward aspects.1 point
-
Beat ya. 43.5° here.1 point
-
Yeah, kind of unusual. AWO came in with 41F.1 point
-
Also, just want to add that the yearly arctic ice minimum has been reached and if it holds at 9/7 would be the earliest minimum on record.1 point
-
Not bad at all. Bust out the bathing suits and BBQ!1 point
-
@ Tom Now that's a fish on! So, what'd you reel in again??1 point
-
Also important is Westerly or Easterly phase(s). Not necessarily for today, but during our upcoming winter. The phase cycle runs approx. 28-29 months. Per Wiki: Effects[edit]Effects of the QBO include mixing of stratospheric ozone by the secondary circulation caused by the QBO, modification of monsoon precipitation, and an influence on stratospheric circulation in northern hemisphere winter (mediated partly by a change in the frequency of sudden stratospheric warmings). Westward phases of the QBO often coincide with more sudden stratospheric warmings, a weaker Atlantic jet stream and cold winters in Northern Europe and eastern USA whereas eastward phases of the QBO often coincide with mild winters in eastern USA and a strong Atlantic jet stream with mild, wet stormy winters in northern Europe (Ebdon 1975).1 point
-
Here are Nov-Jan analogs of a +QBO... vs... -QBO1 point
-
Must be nice having early access lol1 point
-
00z ECMWF rains on Tim's parade..literally1 point
-
As has been pointed out by others, continental-scale reanalysis isn't going to prove anything regarding actual temperatures at the summits. We have two sources of data, both of which show Mt. Rainier as colder than Mt. Washington. Both year round and during DJF. And once again, there's the question of common sense.1 point
-
For the purposes of the webpage, I used all of the years of data available. Mt Washington had a lot more years available. The web page wasn't meant to be used as a debate, only to provide the information that was available. Comparing Mt Washington in the 1970's vs Rainier in the 1970's, I come up with an average winter temperature of 2.0F for Rainier and 7.2F for Mt Washington during the same time periods. It is true that the period of record is short for Mt Rainier, but there isn't more data available. Also, keep in mind that it really only the daytime winter temperatures that are warmer on Mt Rainier, night temperatures are about the same for Rainier and Mt. Washington. I think that whichever time periods are compared, Mt Rainier would probably still be colder because of the colder day temperatures. As mentioned before low temperatures on Mt Washington can drop to colder than Rainier ever gets. Edit: This might be boring to some, but after some searching, I was able to find the old notebooks where I collected some of the Rainier and Paradise info, as well as Mt Washington, long before the internet: http://images.summitpost.org/original/982373.JPG http://images.summitpost.org/original/982374.JPG http://images.summitpost.org/original/982379.JPG I would start with writing the easy to obtain stations (such as Mt Washington) alphabetically on the right side of the notebook and then overtime fill in more stations on the left (at the same time updating the extremes). A trip down memory lane, at least for me (I started these notebooks of weather data in October 1988, at the age of 14). As a random example on page of yearly extremes I compiled for a weather station, all by hand, and pre-internet, this one for Salt Lake City: http://images.summitpost.org/original/982375.JPG To show that I really did compile data accurately and correctly, compare my old notebooks to the now available internet database: http://images.summitpost.org/original/982376.JPG Notice that they match perfectly. I have confidence in the data for that webpage, since I feel that I gathered it correctly.1 point
-
It appears to be neutral going positive if I have read it correctly.1 point
-
Saw this map from the Predictive Ocean Atmosphere Model for Australia (POAMA)...would be nice for many if this pans out! This is a new model along within the NMME group.1 point
-
Went out Salmon fishing very early this morning around 5:00am at Winthrop Harbor. It was a cool and crisp morning, but perfect weather conditions. My buddy landed this 30-33" (didn't take actual measurement) King Salmon roughly at 6:52am on a spoon. Took about 5 minutes to reel her in the boat! She put on a fight. Due to the offshore winds, the lake had upwelled cooler waters from down below and water temp was at 66F.1 point
-
Interesting, but if you compare the data for the same years for those other stations (2010-2016) Embarrass has dropped way down the list. The past few years 2010-2016 have had some warm winters (if it weren't for 2014, Embarrass would just barely beat Peters Sink). Using the NOW Data from NOAA for 2010-2016 for those stations (the same years chosen for Peters Sink), here are some differences (with the example of Embarrass shown): http://www.summitpost.org/images/medium/982247.JPG The order changes somewhat when just 2010-2016 is looked at and Peter Sinks moves up the list: Taylor Park = -9.4 Crested Butte = -8.2 Gunnison = -7.9 Embarrass, MN = -7.8 Peter Sinks = -4.7 Antero Reservoir = -4.5 Boulder Rearing Station = -4.2 In addition to Minnesota, the Wyoming stations for 2010-2016 haven't been nearly as cold as the 1981-2010 averages. Big Piney for example, has only averaged -0.5, much warmer than the 1981-2010 average of -4.0. http://www.summitpost.org/images/medium/982253.JPG Had their been a 1981-2010 average for Peter Sinks, it is possible that it also could have been colder than the 2010-2016 average.1 point
-
Interesting. I have the following records for Oregon, by month Record Hi Max Jan: 80 at Brookings on 28/1994 Feb: 85 at Coquille, Myrtle Point on 25/1992 Mar: 88 at Brookings on 18/1914 Apr: 98 at Cave Junction on 21/2009 May: 108 at Cave Junction on 16/2008 Jun: 113 at Pelton Dam on 23/1992 Jul: 117 at Umatilla on 27/1939 (119 at Pendleton incorrect) Aug: 116 at Spray on 4/1961 Sept: 111 at Illahe on 3/1955 Oct: 104 at Dora on 2/1980 Nov: 88 at Brookings on 2/1929 Dec: 79 at Brookings on 11/1951 I didn't know about most of those RAWS values, so a big thanks for digging those up. Flynn Prairie near Red Mound hit 83 on Jan 15, 2014 (with a low of 67). Record Lo Min: Jan: -52 at Austin on 8/1937 Feb: -54 at Seneca and Ukiah on 9/1933 Mar: -30 at Fremont on 1/1922 Apr: -23 at Meacham on 1/1936 May: 0 at Juniper Lake on 2/1968 Jun: 11 at Crater Lake NP on 12/1952 Jul: 14 at Fremont on 2/1955 Aug: 13 at Seneca on 28/1937 Sep: 1 at Seneca on 1/1931 Oct: -11 at Seneca and Fort Rock on 31/2002 Nov: -32 at Ukiah on 23/1985 Dec: -53 at Riverside on 25/1924 Rec Lo Max: -21 at Austin on Jan 19, 1937 Rec Hi Min: 85 at Arlington on Jul 13, 2002 24 hour precip: Jan: 9.01 at Port Orford 5E on 16/1974 Feb: 7.26 at Valsetz on 1/1927 Mar: 8.79 at Brookings on 18/1932 Apr: 8.06 at Port Orford 5E on 3/1993 May: 6.23 at Laurel Mtn on 6/2009 Jun: 7.78 at Laurel Mtn on 7/1985 Jul: 4.11 at Port Orford 5E on 1/1983 Aug: 4.12 at Langlois on 24/1977 Sep: 5.54 at Port Orford 5E on 27/1981 Oct: 8.90 at Laurel Mtn on 27/1994 Nov: 14.30 at Lees Camp on 6-7/2006 (highest 24 hour total) Dec: 12.33 at Laurel Mtn on 3/2007 Monthly Precip: Jan: 47.23 at Valsetz in 1953 Feb: 39.51 at Laurel Mtn in 1999 Mar: 30.80 at North Fork in 2014 Apr: 26.20 at North Fork in 1993 May: 13.80 at North Fork in 2013 Jun: 13.00 at North Fork in 2010 Jul: 8.21 at Nehalem 8NE in 1983 Aug: 8.78 at Valsetz in 1968 Sep: 18.15 at Laurel Mtn in 2013 Oct: 29.71 at Valsetz in 1956 Nov: 57.00 at Glenora in 1909 Dec: 56.00 at North Fork in 1996 Year Max: 204.12 at Laurel Mtn in 1996 Year Min: 2.56 at Fields in 20021 point


This leaderboard is set to Vancouver/GMT-07:00