

hawkstwelve
-
Posts
22186 -
Joined



hawkstwelve's Achievements






-
Pro-Palestinian protestors blocked access today to O'Hare and SeaTac airports along with the Golden Gate and Brooklyn Bridges as well as I-5 in Eugene, OR. I can't think of a faster way to get otherwise neutrally-stanced people to immediately hate whatever cause you are supposedly championing than to pull that type of shit. What do these protestors even think? Stopping people from going about their day (let alone taking a flight to see a dying loved one or something) is going to solve a conflict that's been going on for centuries? Suddenly Netanyahu is going to say, "Gee, these people in Illinois seem really angry so I guess I should stop the bombing." I mean, really? What's the end goal here besides pissing off your community? Just complete and total morons. Go back to your basements. Or better yet, go find a job so you are doing something more productive with your Monday. Idiots.
-
Iran state media is reportedly showing videos from fires in Chile and Texas, claiming that it's Israel. Definitely seems like this was just a ploy to save face domestically and not to start a wider regional (or world) war. Hopefully cooler heads prevail in whatever response Israel feels like it needs to do.
-
April 2024 Observations and Discussion
hawkstwelve replied to westMJim's topic in East of the Rockies
We have reached up to a very hot feeling 88 degrees today, our highest temp since last October on the 2nd when we reached 92. We're going to be grilling, playing lawn games, and having a bonfire tonight. A little taste of summer in April! -
April 2024 Observations and Discussion
hawkstwelve replied to westMJim's topic in East of the Rockies
Agree with others on the potential for a severe outbreak next week. Latest ECMWF looks pretty nice on the lightning front.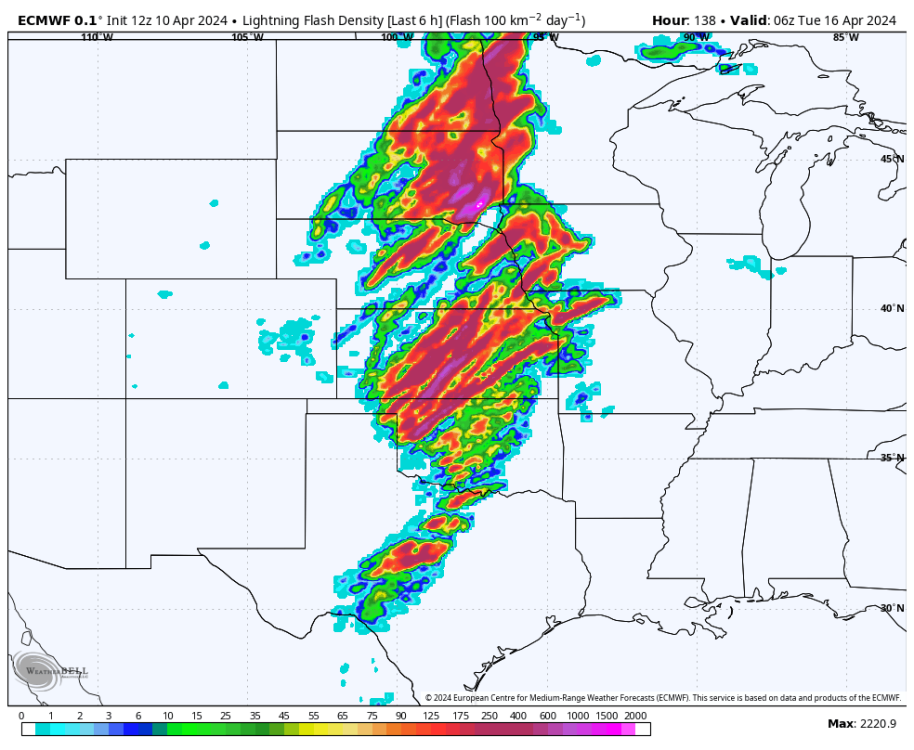
-
April 2024 Observations and Discussion
hawkstwelve replied to westMJim's topic in East of the Rockies
Cool picture of a tornado from 1884 taken in South Dakota. -
April 2024 Observations and Discussion
hawkstwelve replied to westMJim's topic in East of the Rockies
Rest of the week should be fairly quiet after we get hit with some light wrap-around moisture today and some more light precip on Wednesday. We've received 0.57 inches of rain over the past two days. Not great but not terrible either. We look to be warming up to near 80 by the weekend with perhaps another system in about a week, almost an exact replica of this weekend's storm as it's currently modeled. It seems like storms have been rolling through here every 6-8 days since the end of March and that pattern looks to continue for at least another week or two. End of April is looking potentially dry and mild at this point. -
April 2024 Observations and Discussion
hawkstwelve replied to westMJim's topic in East of the Rockies
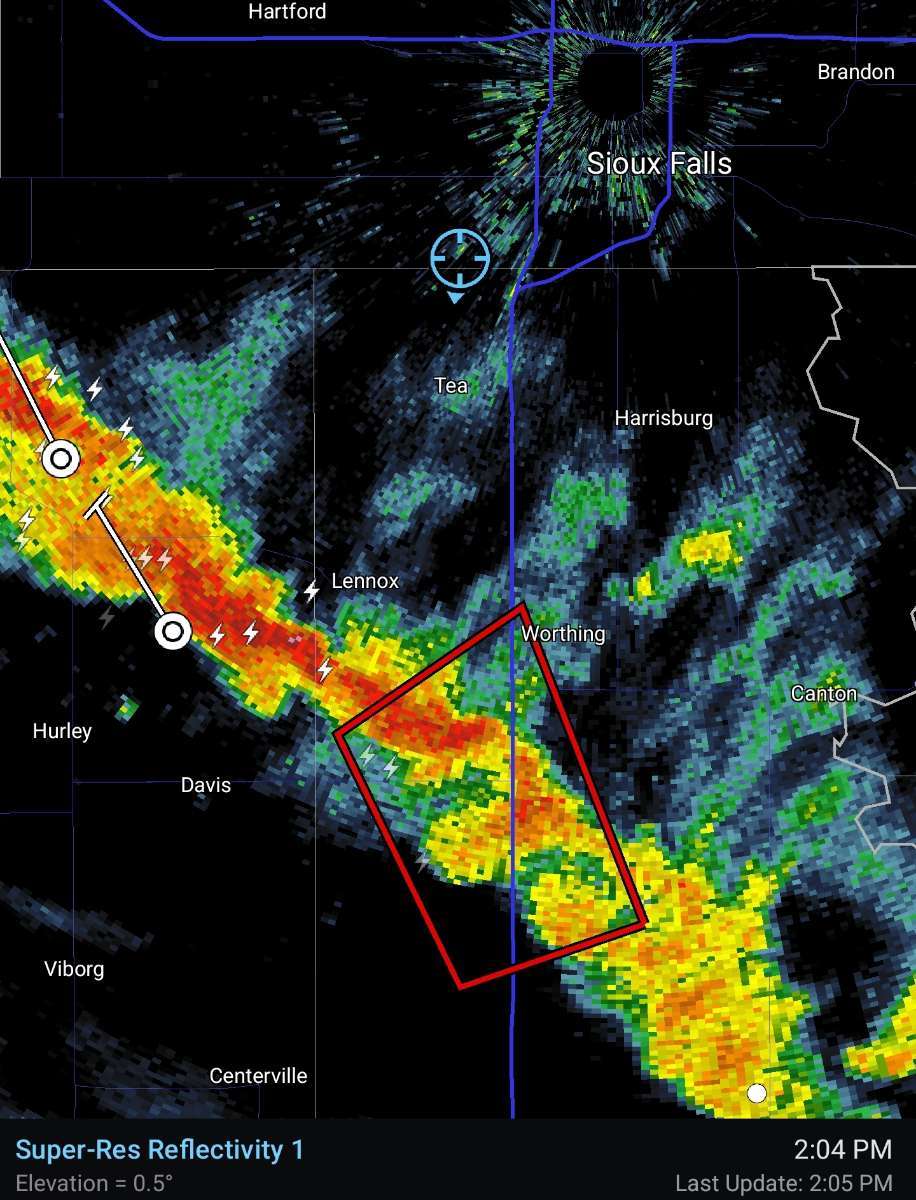
Tornado warning just to my south.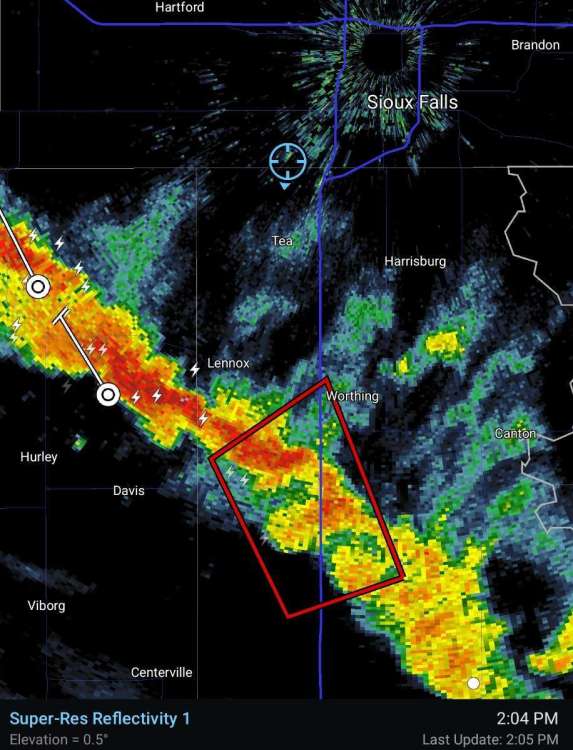
-
April 2024 Observations and Discussion
hawkstwelve replied to westMJim's topic in East of the Rockies
Family and I sat on the back porch last night and watched as the line of thunderstorms rolled in. We saw some large cloud-to-ground lightning strikes and heard some decent rumbles of thunder. It was more than I expected so that was pretty nice. The low is located pretty close to us here today. NWS FSD is pointing out the possibility of landspouts/funnels forming later this afternoon. HRRRRRR shows some thunderstorm redevelopment around 3-6PM. I'll be keeping my eye to the sky today for any rotation! -
April 2024 Observations and Discussion
hawkstwelve replied to westMJim's topic in East of the Rockies
It has been extremely windy here today with partly to mostly sunny skies and a high of 64. Darker clouds are building to my SW though. Really hoping we can score a rumble of thunder and a couple lightning strikes tonight. Looks marginal up here but might just be enough to eek it out if the band can hold together. We shall see. -
A kind of long but interesting read that discusses the problem with the 'white rural rage' myth that some Democrats are adopting in regards to rural America. https://www.politico.com/news/magazine/2024/04/05/white-rural-rage-myth-00150395
-
Watch it, dude. If you continue to do nothing but troll people in this thread, I will straight up ban you. Maybe from the forum altogether, as from what I have seen in the PNW thread recently, you like stirring the pot there too. Just about had enough.
-
Hello pot, meet kettle.
-
April 2024 Observations and Discussion
hawkstwelve replied to westMJim's topic in East of the Rockies
A little closer in the near term, the ECMWF is showing some lightning around with this weekend's system. Sounds like these could be accompanied by some fairly strong winds. Perhaps a secondary, but growing concern could be with the winds Saturday evening into the early overnight hours. Southeast low-lvl flow is expected to ramp up quickly Saturday evening with 925 mb winds off the EC pushing 55 knots, and GFS pushing 50 knots ahead of and along the advancing corridor of rain. These winds sit at the 99th percentile or in some cases outside the 30 year model climatology for early April, especially at the 850/700 mb layers. Could see a scenario where high gusts mixdown with the rain and embedded thunderstorms Saturday evening. While the NBM winds (gusting over 60 mph) may be a bit on the high side, it should be noted that both the EC/GFS/GEM/NAM all produce a corridor of 50 to 55 mph gusts as the precipitation moves northeast. The GEFS/EPS also note mean wind gusts between 45 and 50 mph Saturday evening, with more than a handful of members over 50 mph.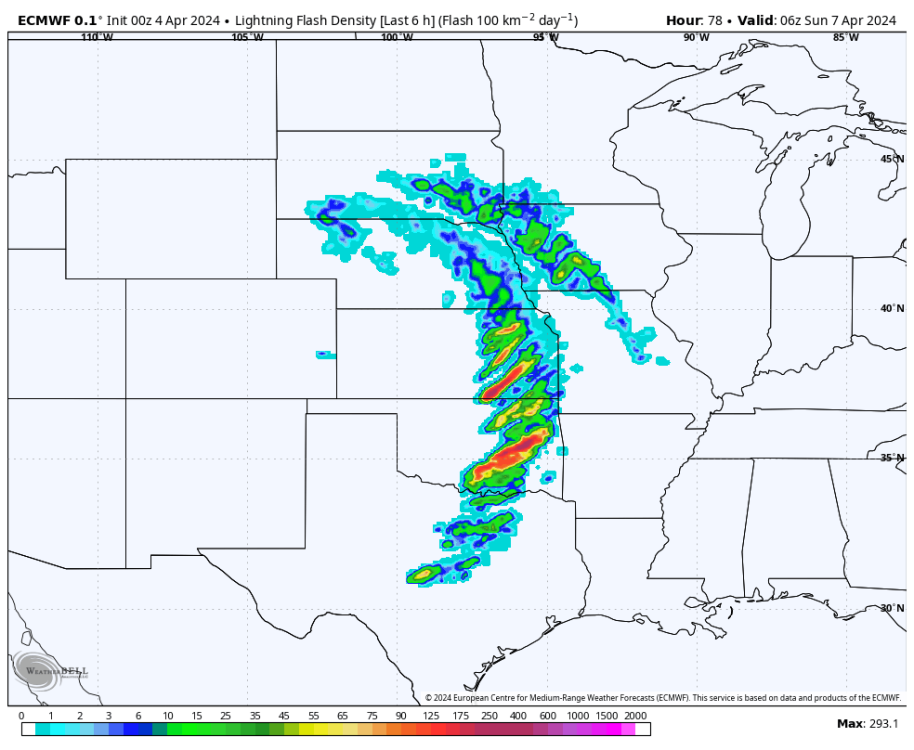
-
April 2024 Observations and Discussion
hawkstwelve replied to westMJim's topic in East of the Rockies
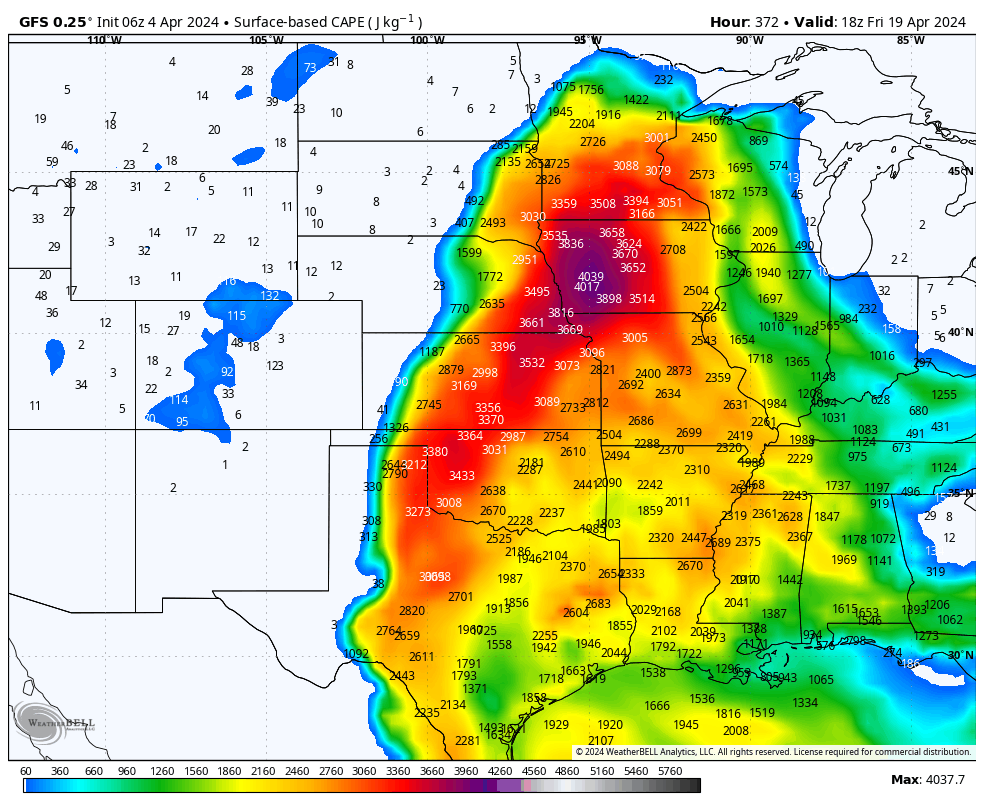
It's obviously a long ways out there but the GFS is showing some gulf moisture and accompanying high CAPE values making it up to my neck of the woods on my birthday. Some birthday fireworks Mother Nature style.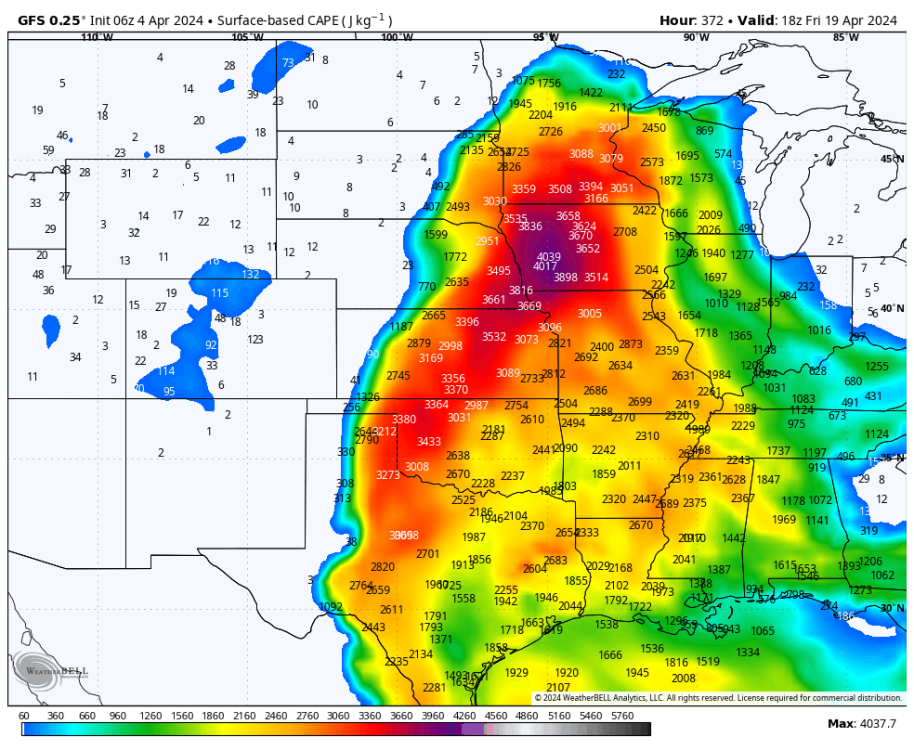
-
Did he prioritize it? Didn't he go to Easter mass? Did Trump go to Easter mass? Look, I'm not a Biden fan in the slightest, but on the one hand you have a president attending Easter mass and on the other hand you have a former president marketing his $60 bibles. You tell me who is prioritizing what. The 'proclamation' Biden did was horrible timing, yes. Typical screwup from his White House comms office. But it is incredibly dishonest to frame this as him trying to "erase Easter" or "replace God with trans", which I saw all over Fox News and from Republican congressmen. It's such a naked ploy to just gin up anger with the base, especially when it's something that can be disproven with just 30 seconds of research. Unfortunately, taking that amount of time to check things out is just asking too much from some Americans these days. They'd rather spend their time in a perpetual outrage at the other side. So stupid.