
-
Who's Online 11 Members, 0 Anonymous, 64 Guests (See full list)
-
Popular Contributors
-
1

-
2
-
3

-
4
-
5

-
-
Activity Stream
-
1779
April 2024 Weather in the PNW
Been saying this for awhile. 2024 will probably be the hottest summer on record for the lower-48. All forcing components are lining up in the worst way possible. -
1779
April 2024 Weather in the PNW
Where they have “equal chances” is probably where the warmest anomalies will end up. Lmao. -
1779
April 2024 Weather in the PNW
Huh? No I wasn’t. Unless it was an in-jest comment about a single long range model run. -
1779
April 2024 Weather in the PNW
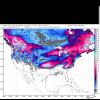
This is what 2017 looked like on this date. LA NINA! -
1779
April 2024 Weather in the PNW
NOAA has been having a rough time lately. Horrible busts last winter on both the seasonal and subseasonal scales. Idk what their methodology is but it’s been failing them since the niño established. IIRC they rely heavily on the IRI which is notoriously bad when seasonal/LF forcing components destructively interfere w/ canonical EOFs (example: strong niño in tandem with -PMM).
-


Recommended Posts
Join the conversation
You can post now and register later. If you have an account, sign in now to post with your account.