Jump to content

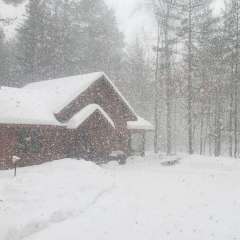
Jan 10th/11th Disturbance - Is that snow or middle fingers falling from the sky?


Madtown

Recommended Posts

If I got only half of the snow the models showed 5 days out this winter I'd be a happy man. But I've seen this act before. When we wake up tomorrow and view the 6z runs this puppy is gonna be a Dakotas special. The NW trend is real.

Ya I would side with your thinking

Link to comment
Share on other sites

According to what Gary Lezak said in his blog this morning, I think this storm is correlating with the one that hit on Nov 17th-18th and is taking nearly the same identical track again which will target ND/MN and possibly a little more in WI than in the previous cycle.

Link to comment
Share on other sites

The amount of wound up storms the Upper Midwest/Lakes have had this season is mind boggling and we ain't half way thru.


They've wound-up (and been wound-up, lol) all winter north of Superior. Not sure that qualifies as "The Lakes". And with them so warm, the cold comes in late and thus we get LES in a sort of delayed reaction scenario. Still waiting for a storm like recent GGEM shows where the system's actually bombing and forcing cold air in with a low baro. Backside bliz conditions can be a nice consolation prize if you miss the synoptic hit, but the set-up is a rare one. Again, models have shown them wound-up over MI, but in reality they've ended up way west at their peak strength benefiting Dakotas and MN more than MI.

Winter 2023-24 Snow Total = 53.1" (90% Normal Season)  Largest Storm: 12" (1/12-13)   Oct: 0.1 Nov: 2.9 Dec: 7.5 Jan: 31.7 Feb: 6.0 Mar: 4.3 Apr: 0.1

Avg = 59.2"  (Harrison): 2023-24 = 53.1" 

Avg = 45.0"  (KDTW): 2022-23 = 33.5"   2021-22 = 35.6"    

Avg = 49.7"  (KRMY): 2020-21 = 36.2"   2019-20 = 48.0"   2018-19 = 56.1"   2017-18 = 68.3"    2016-17 = 52"    2015-16 = 57.4"    2014-15 = 55.3"    2013-14 = 100.6" (coldest & snowiest in the modern record!)  2012-13 = 47.2"    2011-12 = 43.7"

Legit Blizzards (high winds and dbl digit snows): Feb 2011, Dec 2009, Jan 2005, Dec 2000, Jan 1999, Mar 1998, Nov 1989, Jan 1982, Jan 1978, Jan 1977, Apr 1975, Mar 1973, Jan 1967, Feb 1965, Jan 1918

Link to comment
Share on other sites

They've wound-up (and been wound-up, lol) all winter north of Superior. Not sure that qualifies as "The Lakes". And with them so warm, the cold comes in late and thus we get LES in a sort of delayed reaction scenario. Still waiting for a storm like recent GGEM shows where the system's actually bombing and forcing cold air in with a low baro. Backside bliz conditions can be a nice consolation prize if you miss the synoptic hit, but the set-up is a rare one. Again, models have shown them wound-up over MI, but in reality they've ended up way west at their peak strength benefiting Dakotas and MN more than MI.

Ok Mr. Technicality!  LOL, you could put a "N" in front of "The Lakes" to make it more clearer.   B)   Getting a wound up storm to form to our SW is going to be really tough in this pattern we are in.  Unless of course, things change in Feb and the AO really tanks as well as some better blocking near Greenland.

Link to comment
Share on other sites

Ok Mr. Technicality!  LOL, you could put a "N" in front of "The Lakes" to make it more clearer.   B)   Getting a wound up storm to form to our SW is going to be really tough in this pattern we are in.  Unless of course, things change in Feb and the AO really tanks as well as some better blocking near Greenland.


Sure need that, don't we. 


Warning, the following map showing KTOL with over 2 feet is totally:


Niko, we need a slight bump north buddy! #shades-of-67

Winter 2023-24 Snow Total = 53.1" (90% Normal Season)  Largest Storm: 12" (1/12-13)   Oct: 0.1 Nov: 2.9 Dec: 7.5 Jan: 31.7 Feb: 6.0 Mar: 4.3 Apr: 0.1

Avg = 59.2"  (Harrison): 2023-24 = 53.1" 

Avg = 45.0"  (KDTW): 2022-23 = 33.5"   2021-22 = 35.6"    

Avg = 49.7"  (KRMY): 2020-21 = 36.2"   2019-20 = 48.0"   2018-19 = 56.1"   2017-18 = 68.3"    2016-17 = 52"    2015-16 = 57.4"    2014-15 = 55.3"    2013-14 = 100.6" (coldest & snowiest in the modern record!)  2012-13 = 47.2"    2011-12 = 43.7"

Legit Blizzards (high winds and dbl digit snows): Feb 2011, Dec 2009, Jan 2005, Dec 2000, Jan 1999, Mar 1998, Nov 1989, Jan 1982, Jan 1978, Jan 1977, Apr 1975, Mar 1973, Jan 1967, Feb 1965, Jan 1918

Link to comment
Share on other sites

Sure need that, don't we. 


Warning, the following map showing KTOL with over 2 feet is totally:


attachicon.gif20161107 Snow Clownage.png


attachicon.gif20170107 GFS 0z 228hr snowfall.png


Niko, we need a slight bump north buddy! #shades-of-67

http://maps1.pivotalweather.com/maps/models/gfs/2017010600/240/snku_acc.us_mw.pngAll sleet in there

Link to comment
Share on other sites

http://maps1.pivotalweather.com/maps/models/gfs/2017010600/240/snku_acc.us_mw.pngAll sleet in there


Slightly different than TT's map, eh? Fluke?

Winter 2023-24 Snow Total = 53.1" (90% Normal Season)  Largest Storm: 12" (1/12-13)   Oct: 0.1 Nov: 2.9 Dec: 7.5 Jan: 31.7 Feb: 6.0 Mar: 4.3 Apr: 0.1

Avg = 59.2"  (Harrison): 2023-24 = 53.1" 

Avg = 45.0"  (KDTW): 2022-23 = 33.5"   2021-22 = 35.6"    

Avg = 49.7"  (KRMY): 2020-21 = 36.2"   2019-20 = 48.0"   2018-19 = 56.1"   2017-18 = 68.3"    2016-17 = 52"    2015-16 = 57.4"    2014-15 = 55.3"    2013-14 = 100.6" (coldest & snowiest in the modern record!)  2012-13 = 47.2"    2011-12 = 43.7"

Legit Blizzards (high winds and dbl digit snows): Feb 2011, Dec 2009, Jan 2005, Dec 2000, Jan 1999, Mar 1998, Nov 1989, Jan 1982, Jan 1978, Jan 1977, Apr 1975, Mar 1973, Jan 1967, Feb 1965, Jan 1918

Link to comment
Share on other sites

Sure need that, don't we. 


Warning, the following map showing KTOL with over 2 feet is totally:


attachicon.gif20161107 Snow Clownage.png


attachicon.gif20170107 GFS 0z 228hr snowfall.png


Niko, we need a slight bump north buddy! #shades-of-67

Not sure if I am reading the numbers right, but, that shows my area between 18-24". Man, that looks real snowy.

Snowfall for Winter 2023 -24 for Metro Detroit Area 

Oct 2023: 0.2" AN

Nov 2023: 2.2" AN

Dec 2023: 0.5" BN Insane!

Jan 2024: 17.0" AN

Feb 2024: 1.9"  BN Insane!

Mar 2024: 4.9" BN

April 2024: Trace

Season So Far: 26.7"

Link to comment
Share on other sites

The EURO is good for msp-

TUE 00Z 10-JAN  -7.1    -4.8    1015      84      97    0.09     548     536   
TUE 06Z 10-JAN  -5.1    -6.1    1006      84      99    0.08     544     539   
TUE 12Z 10-JAN  -4.1    -4.0     997      84     100    0.09     538     540   
TUE 18Z 10-JAN  -3.5    -7.9     995      82      88    0.10     530     534   
WED 00Z 11-JAN -12.9   -16.6    1006      75      95    0.16     522     518   
WED 06Z 11-JAN -17.7   -17.0    1018      75       3    0.00     525     512

  • Like 1

The two loudest sounds known to man: a gun that goes bang when it is supposed to go click and a gun that goes click when it is supposed to go bang.

Link to comment
Share on other sites

The EURO is good for msp-

TUE 00Z 10-JAN -7.1 -4.8 1015 84 97 0.09 548 536

TUE 06Z 10-JAN -5.1 -6.1 1006 84 99 0.08 544 539

TUE 12Z 10-JAN -4.1 -4.0 997 84 100 0.09 538 540

TUE 18Z 10-JAN -3.5 -7.9 995 82 88 0.10 530 534

WED 00Z 11-JAN -12.9 -16.6 1006 75 95 0.16 522 518

WED 06Z 11-JAN -17.7 -17.0 1018 75 3 0.00 525 512

How does it look for kosh?

Link to comment
Share on other sites

Pivotal takes into account ratios using the kuchera method.  


I was posting it for clownage basically and good laughs cuz what gosaints said, TT map was counting 4-6" of sleet as snow :lol: :lol:


Lol that run verbatim gave u a solid 4 inches of sleet.  Its a 10:1 ratio map that counts anything frozen as snow. 


At least 4, maybe 6 :P   But, that's the only way we can get a model to flash such huge snow totals lol

Winter 2023-24 Snow Total = 53.1" (90% Normal Season)  Largest Storm: 12" (1/12-13)   Oct: 0.1 Nov: 2.9 Dec: 7.5 Jan: 31.7 Feb: 6.0 Mar: 4.3 Apr: 0.1

Avg = 59.2"  (Harrison): 2023-24 = 53.1" 

Avg = 45.0"  (KDTW): 2022-23 = 33.5"   2021-22 = 35.6"    

Avg = 49.7"  (KRMY): 2020-21 = 36.2"   2019-20 = 48.0"   2018-19 = 56.1"   2017-18 = 68.3"    2016-17 = 52"    2015-16 = 57.4"    2014-15 = 55.3"    2013-14 = 100.6" (coldest & snowiest in the modern record!)  2012-13 = 47.2"    2011-12 = 43.7"

Legit Blizzards (high winds and dbl digit snows): Feb 2011, Dec 2009, Jan 2005, Dec 2000, Jan 1999, Mar 1998, Nov 1989, Jan 1982, Jan 1978, Jan 1977, Apr 1975, Mar 1973, Jan 1967, Feb 1965, Jan 1918

Link to comment
Share on other sites

Lol that run verbatim gave u a solid 4 inches of sleet.  Its a 10:1 ratio map that counts anything frozen as snow. 

We shall see! UGH!! That would be awful if that were to happen. :blink:


Watch we get a 2-3ft snowstorm and Jaster and I are the winners in this whole entire sub-forum. Ya neva know. Keep hope alive! :lol: :lol:

Snowfall for Winter 2023 -24 for Metro Detroit Area 

Oct 2023: 0.2" AN

Nov 2023: 2.2" AN

Dec 2023: 0.5" BN Insane!

Jan 2024: 17.0" AN

Feb 2024: 1.9"  BN Insane!

Mar 2024: 4.9" BN

April 2024: Trace

Season So Far: 26.7"

Link to comment
Share on other sites

Join the conversation

You can post now and register later. If you have an account, sign in now to post with your account.

Guest
Unfortunately, your content contains terms that we do not allow. Please edit your content to remove the highlighted words below.
Reply to this topic...

×   Pasted as rich text.   Paste as plain text instead

  Only 75 emoji are allowed.

×   Your link has been automatically embedded.   Display as a link instead

×   Your previous content has been restored.   Clear editor

×   You cannot paste images directly. Upload or insert images from URL.

Loading...

×
×
  • Create New...