


OmahaSnowFan
-
Posts
2693 -
Joined
-
Last visited
-
Days Won
1
Posts posted by OmahaSnowFan
-
-
-
32 minutes ago, Bellona said:
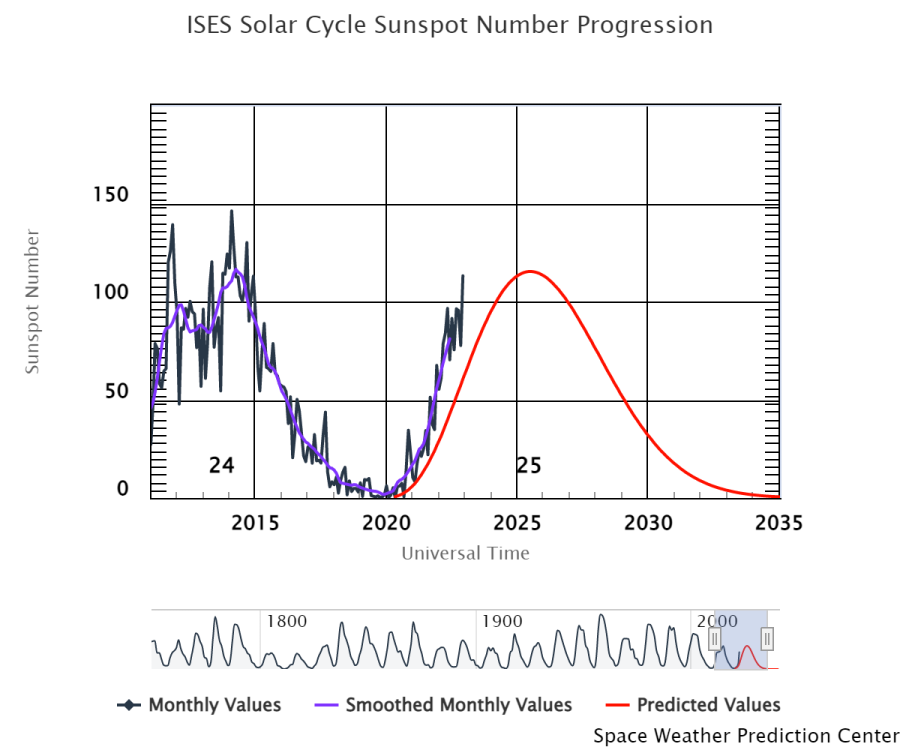
Sunspot activity has been above projected numbers for 35 straight months now. There's a relatively new theory about a magnetic collapse of some sort that may or may not have happened. If such an event did occur, not the regular flipping of sunspot poles, etc., the theory is an intense solar cycle should occur. Evidence would suggest this is the case thus far. Is it coincidence? Time will tell.
*I probably watch space weather more than here*
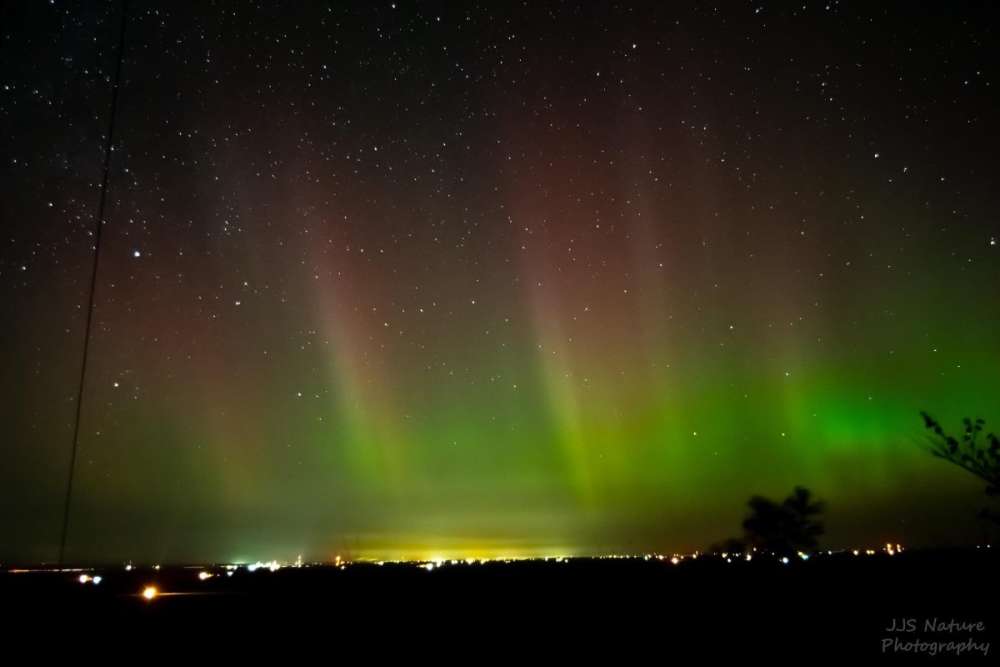
I love space weather too. It’s a dream of mine to go to Iceland and sit under the skies and watch the Northern Lights dance overhead.
We don’t usually get the Lights down here but lucked out a little over a year ago and I was able to see them on the horizon (with a long exposure).
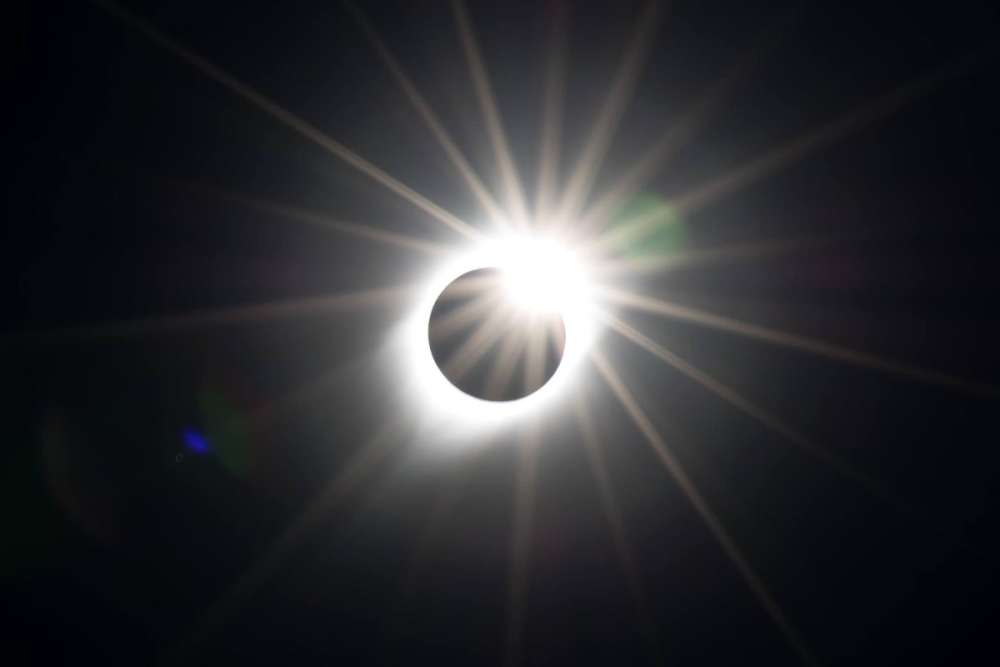
I already have plans with hotels booked to see the total annular eclipse in New Mexico this October as it crosses the US, and the total eclipse next April watching from somewhere in Texas!
-
 2
2
-
-
2 hours ago, jaster220 said:
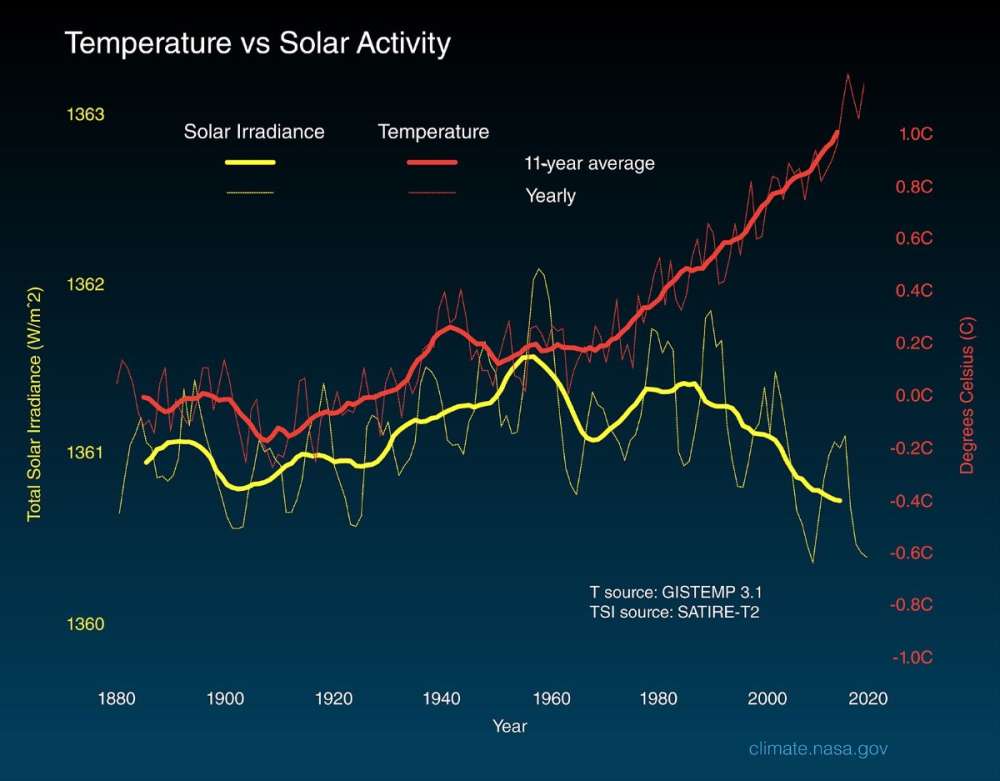
Do you know where that temp is for?
Here’s the page the graph came from: https://climate.nasa.gov/climate_resources/189/graphic-temperature-vs-solar-activity/
-
 1
1
-
-
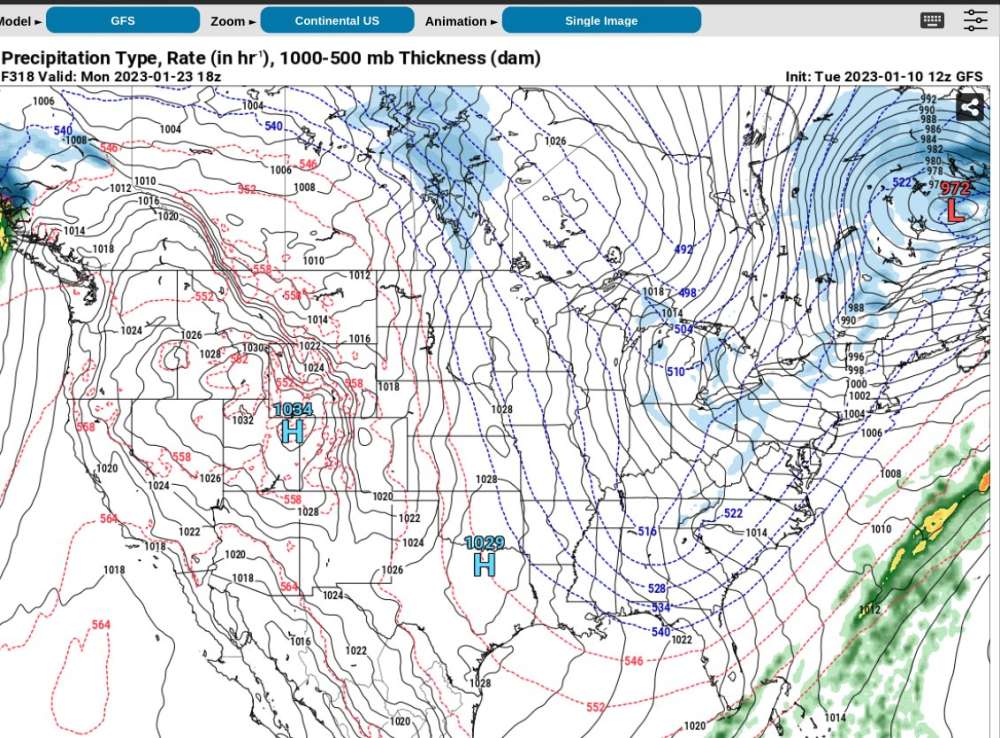
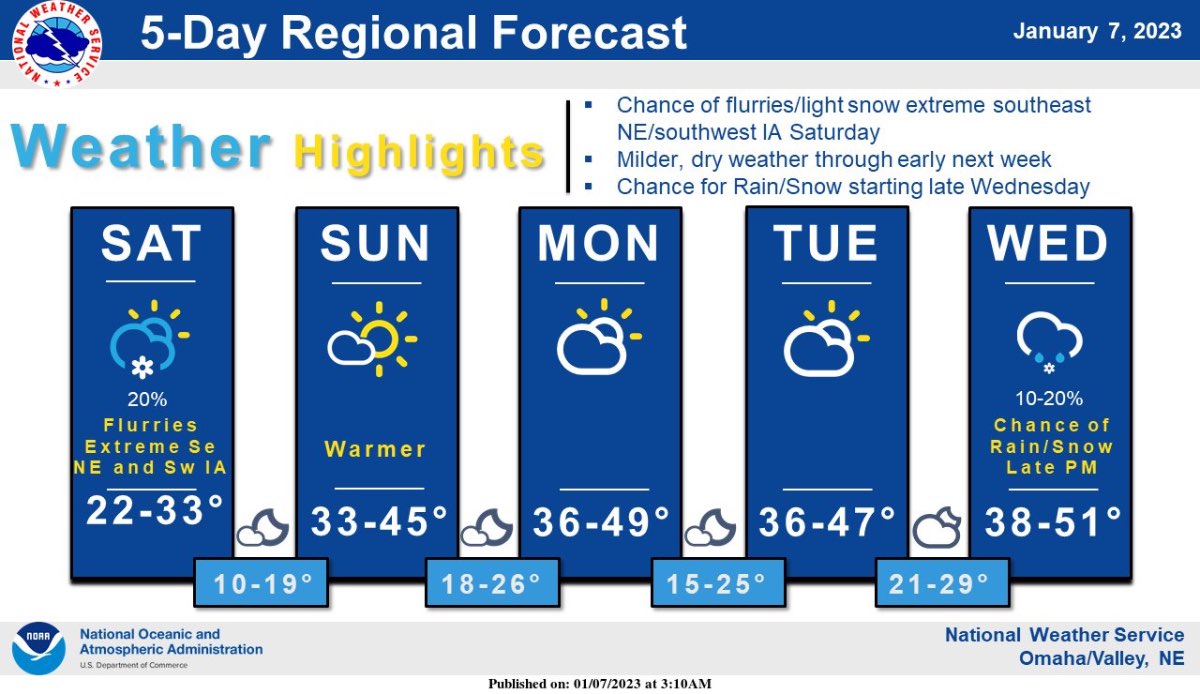
The pattern change that keeps getting delayed.
First it was after the 10th. Then the middle of the month. Now it’s the last 8-9 days of the month.
None of the cold shots have any staying power.
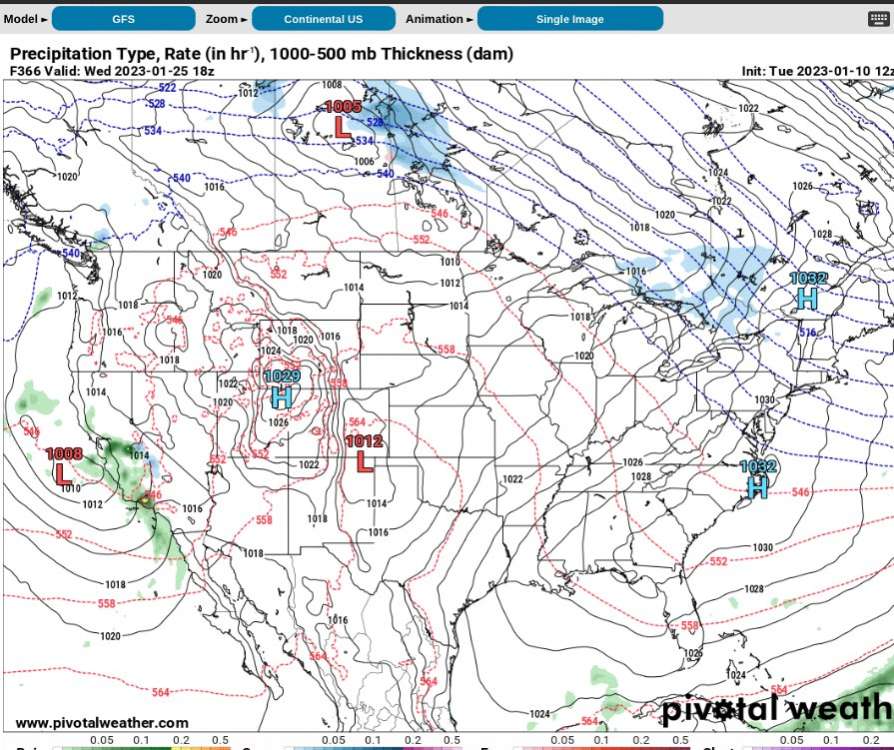
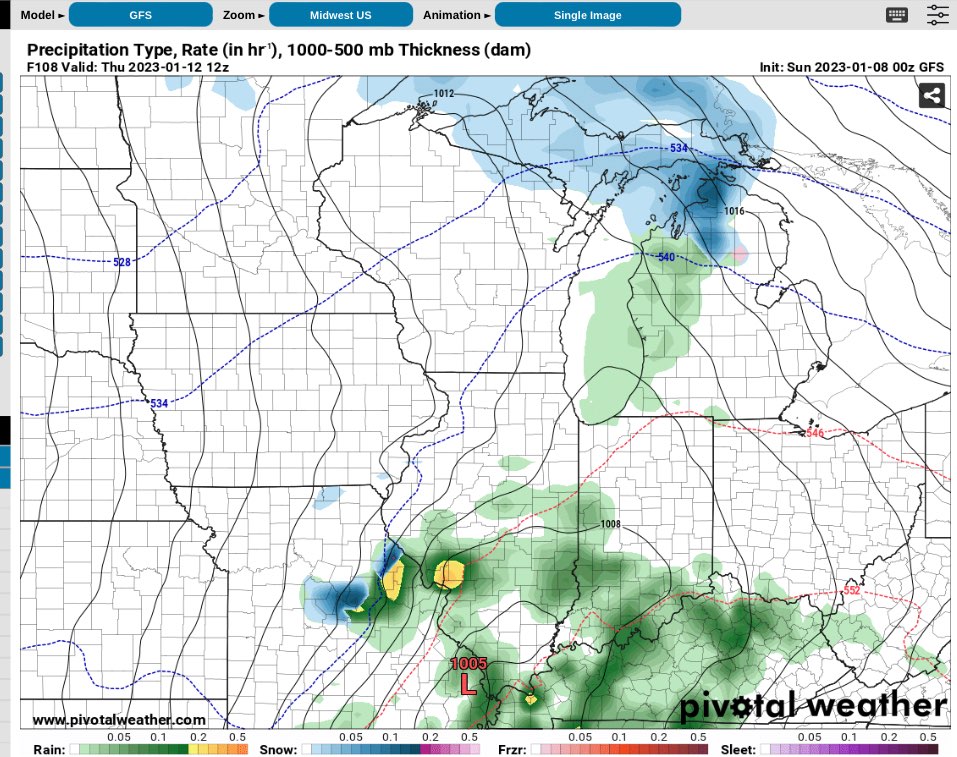
I get we’re at the end of the GFS run, but in the first image it shows a big trough over the east, and only 48 hours later has it lifting rapidly away and already filled in by warm ridging.
-
20 hours ago, sumweatherdude said:
Kind of off topic, but space weather is still weather. The sun has been materially more active than was anticipated thus far in this cycle. December was a big jump. January started off a little lower, but it's starting to pick back up the last few days.
Found this graph that shows the increasing lack of direct correlation between low sunspot activity and temperatures, something the “morons” at NASA correctly predicted about this most recent lull in activity.
-
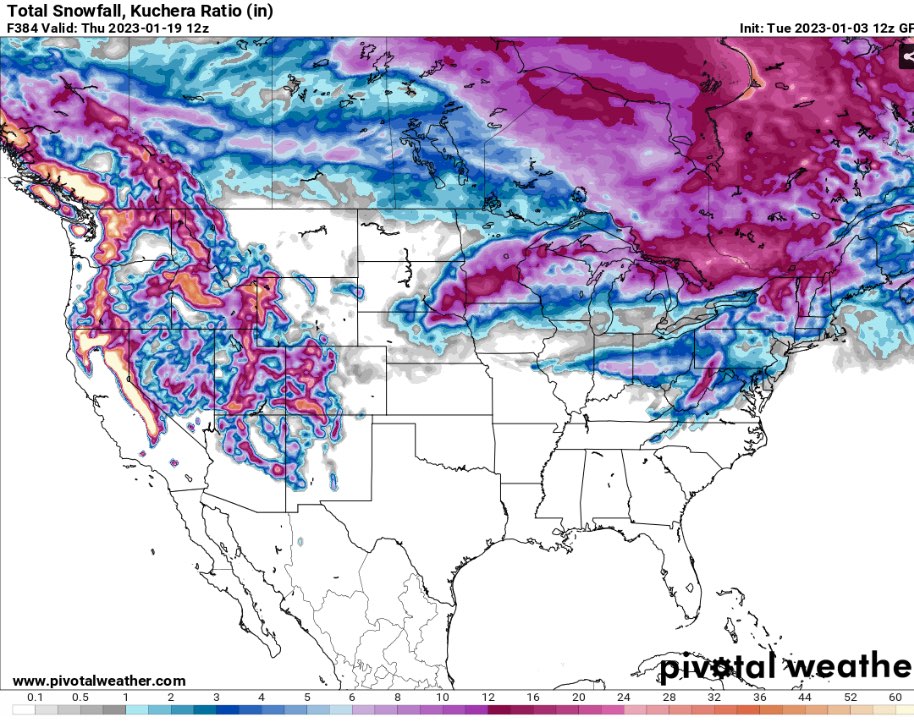
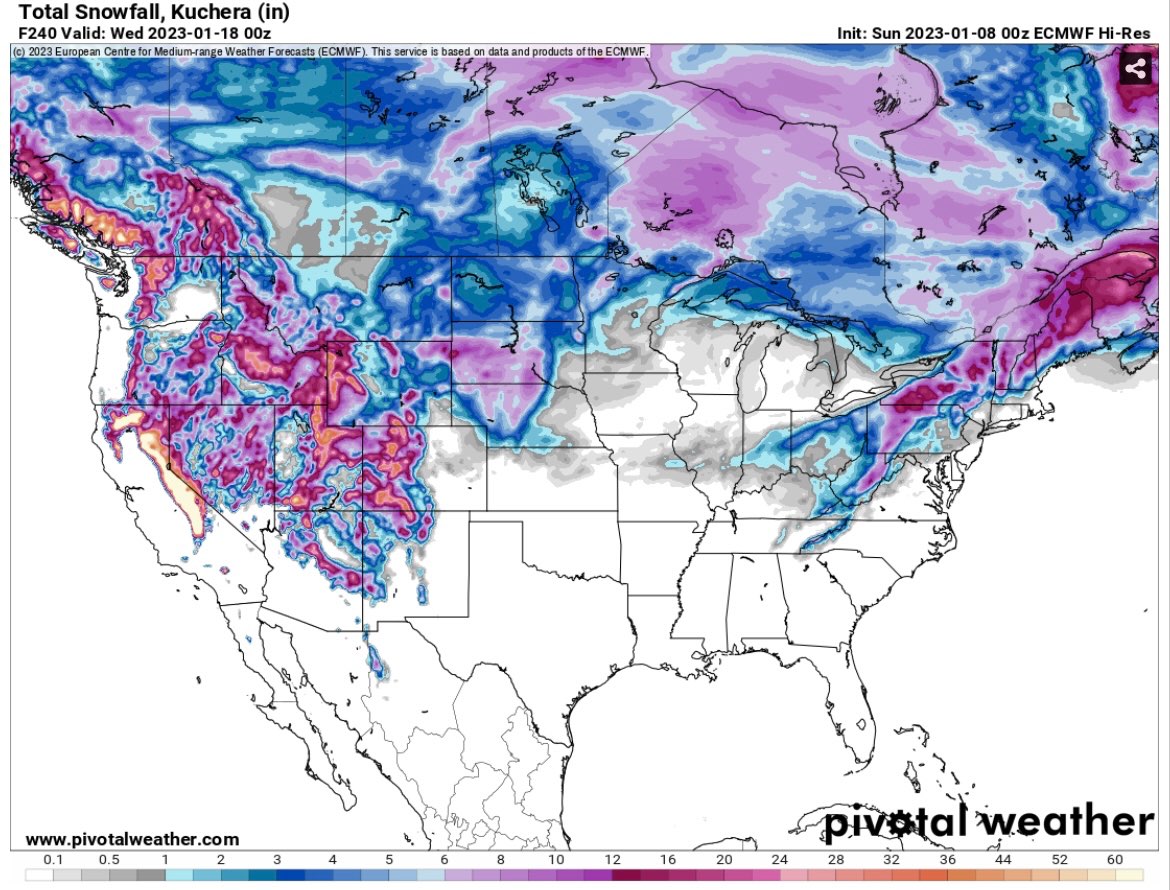
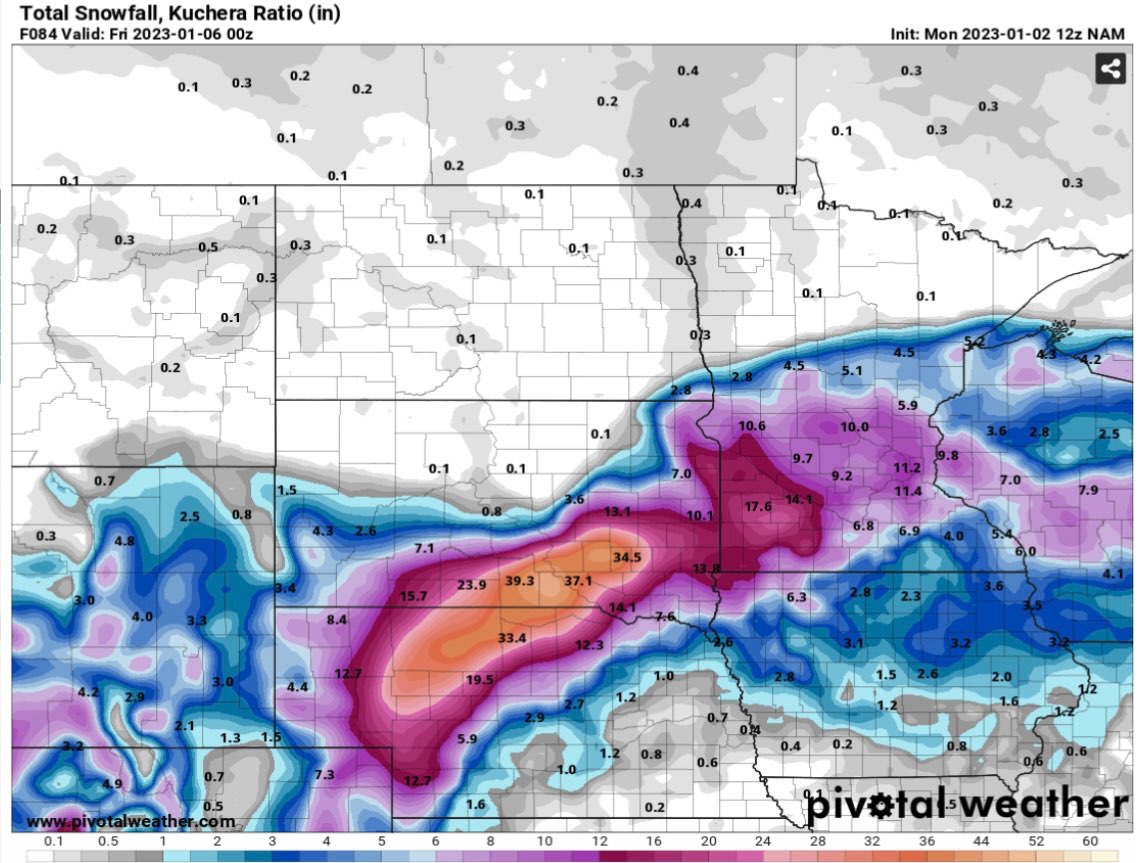
0Z GFS
#NoWinterInJanuary
-
 1
1
-
 1
1
-
-
-
Rumor is it’s snowing a lot in the Sierra’s
-
1
-
 2
2
-
-
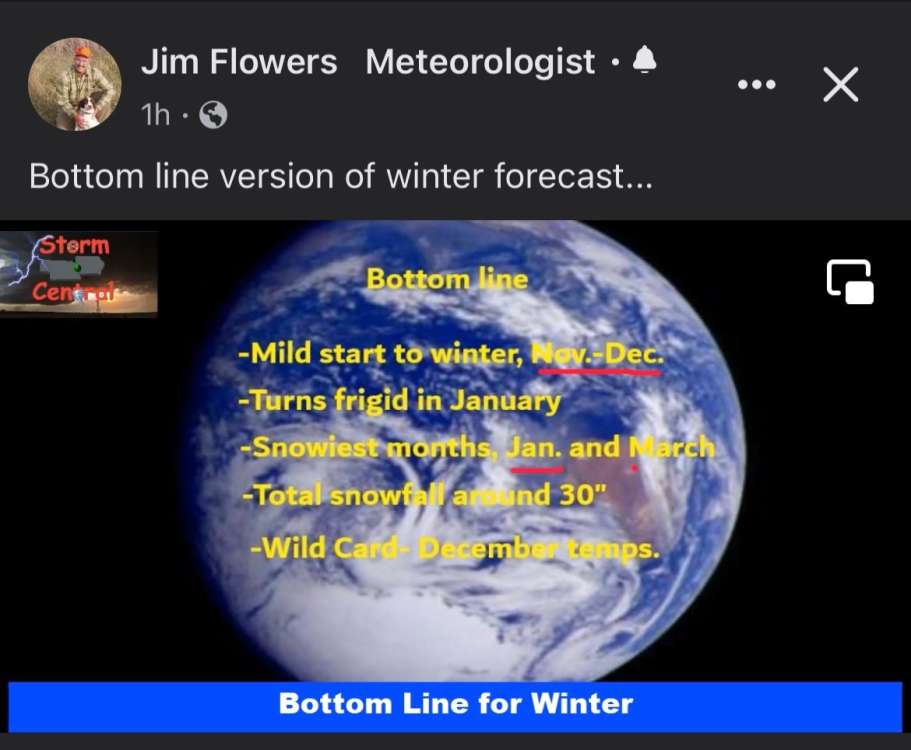
50.4 degrees so far today and lots of sunshine.
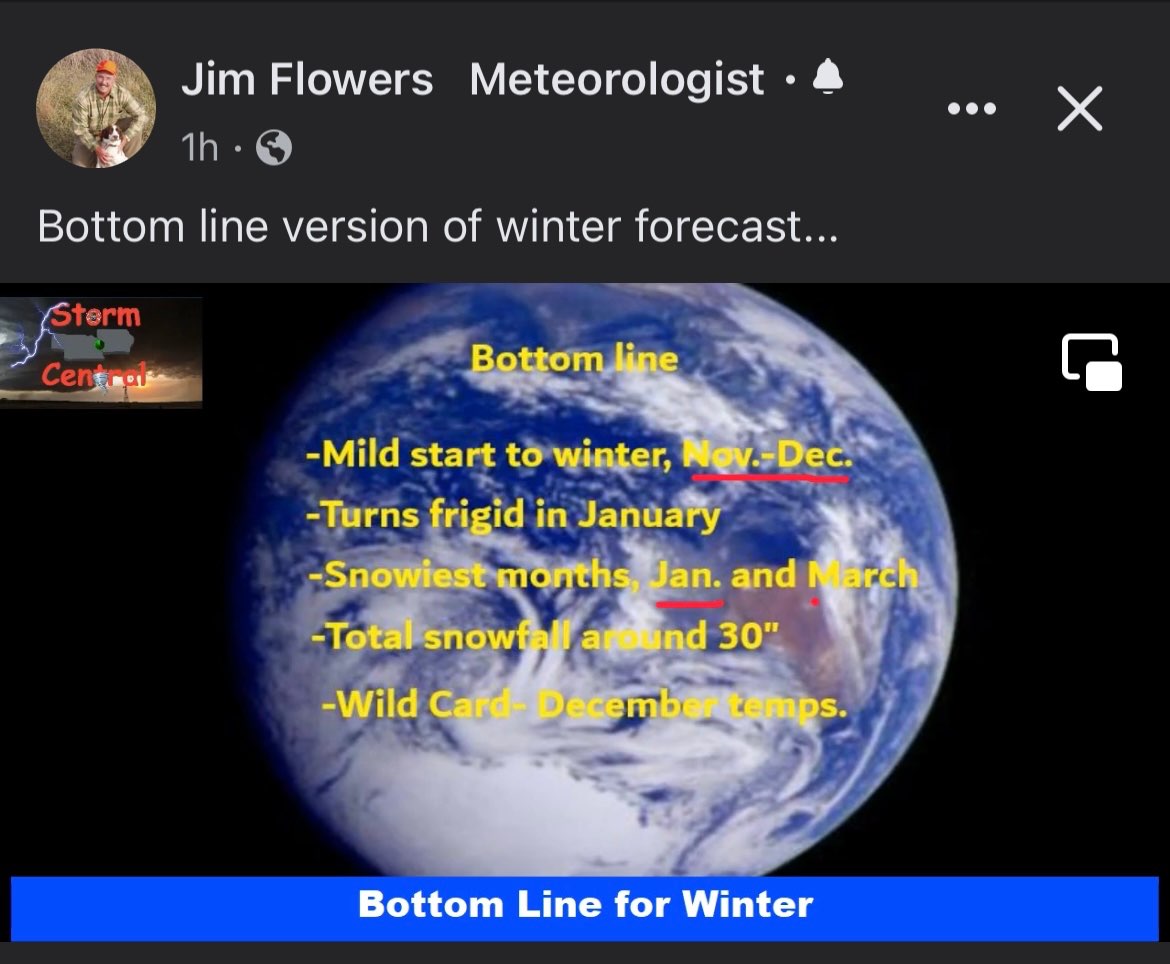
I saved Jim Flowers’ winter forecast and so far not looking too good. December was below average and January has been way above average. Of course, the 4” of snow we’ve had is nowhere close to 30” either, but our biggest storms can still occur of course.
-
At least it’s not cold and snowless.
14/33 are the averages this time of year.
-
2
-
-
-
6 hours ago, Grizzcoat said:
The thing about the GFS is it's 18Z and 06Z runs are complete joke past 72-96 hours--- a reason why not to trust the snow event that current 18Z is showing for S.IA and points E. It will revert back to S and rain for most.
Yep!

-
1
-
-
12Z GFS got rid of the snowstorm just like the Euro.
Everyone’s favorite model is always whichever one is good for them. GFS was RAILED ON here for the last storm, and has been for a long time, but in the end could be considered as doing just as well as the Euro in that they were both wrong 4-5 days out by quite a bit.
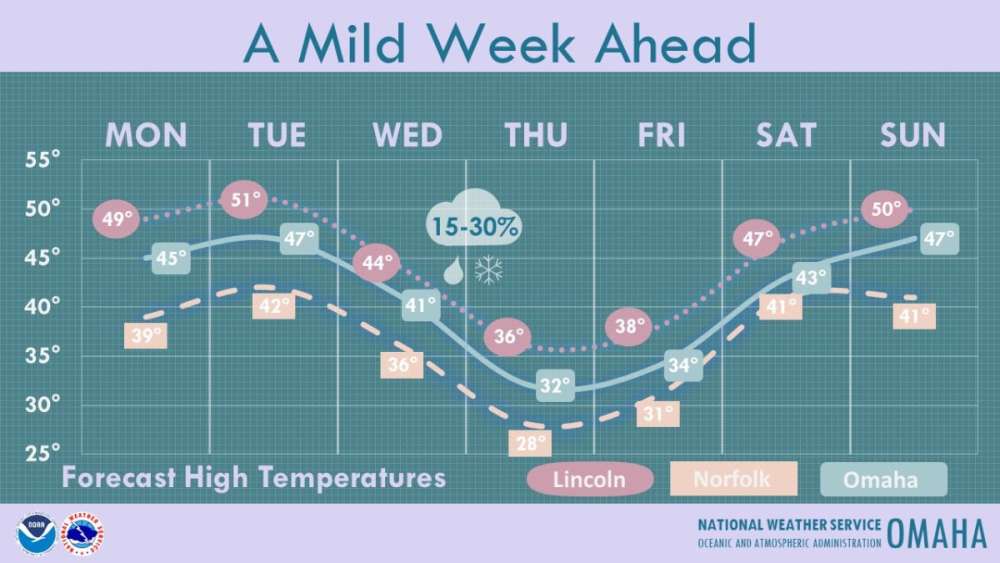
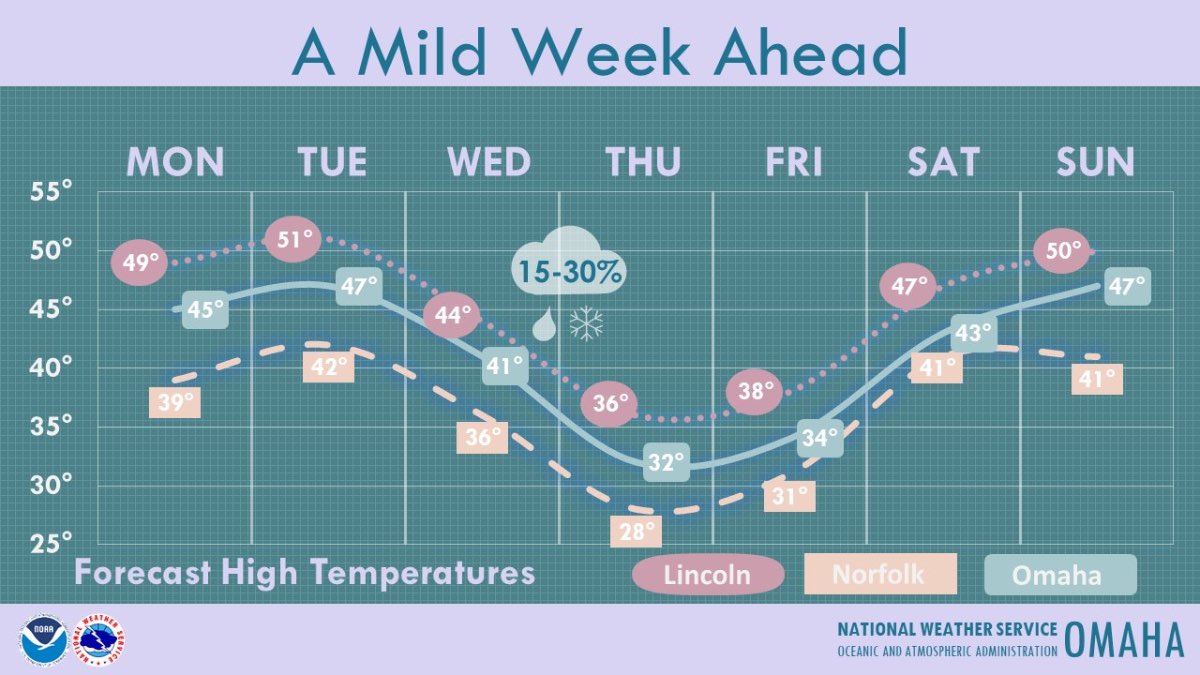
Meanwhile nice week here coming up!
-
1
-
-
So the “garbage, absolute trash model” GFS shows a decent snowstorm, but the “king” Euro shows a rain only system….
I guess that means it’s going to rain right?
-
 1
1
-
 3
3
-
-
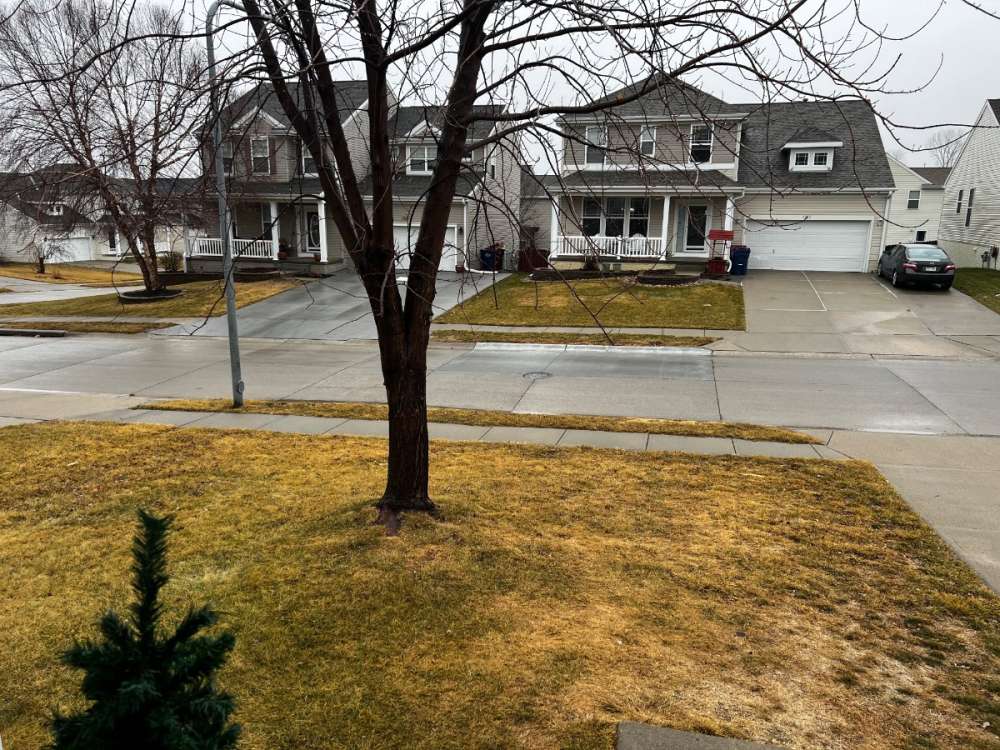
The .7” of snow from the last storm has melted and we’re in the mid 40s today.
Saw that we gain ~40 minutes of daylight this month and can’t help to think of spring already.
-
2
-
 1
1
-
-
My 2022 stats from my weather station IMBY.
Avg low: 39.8
Normal low: 42.1
Dep: -2.3
Coldest daily low: -15.2 (12/22) Coldest daily high: -3.3 (12/22)
Avg high: 63.9
Normal high: 62.8
Dep: +1.1
Warmest daily low: 78.3 (6/13) Warmest daily high: 101.5 (8/6)
Total precipitation: 23.12"
Normal precipitation: 31.86"
Dep: -8.74"
Wettest day: 1.42" (6/15)
Wettest month: 4.93" (May)
Snowfall: 13.5"
Departure: -13.6"
Highest daily snowfall: 3.5" (1/14) Highest monthly snowfall: 6.5" (January)
9 daily record highs
2 daily record lows
1 daily minimum max temp
4 daily maximum min temps
11 severe tstorm watches
2 tornado watches
5 severe tstorm warnings
1 flood watch
10 heat advisories
1 excessive heat warning
6 wind advisories
2 high wind warnings
8 red flag warnings
7 winter weather advisories
2 winter storm warnings
3 wind chill advisories
1 wind chill warning
1 freeze warning
2 dense fog advisories
-
5
-
-
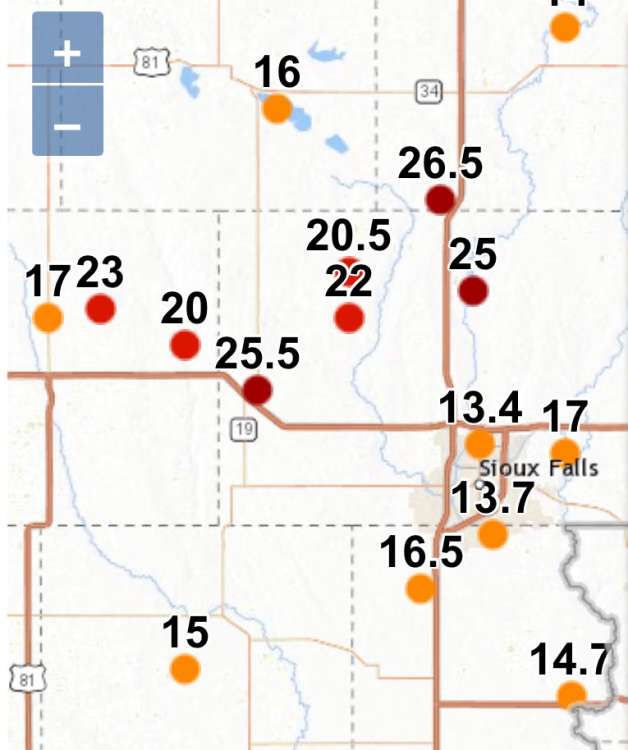
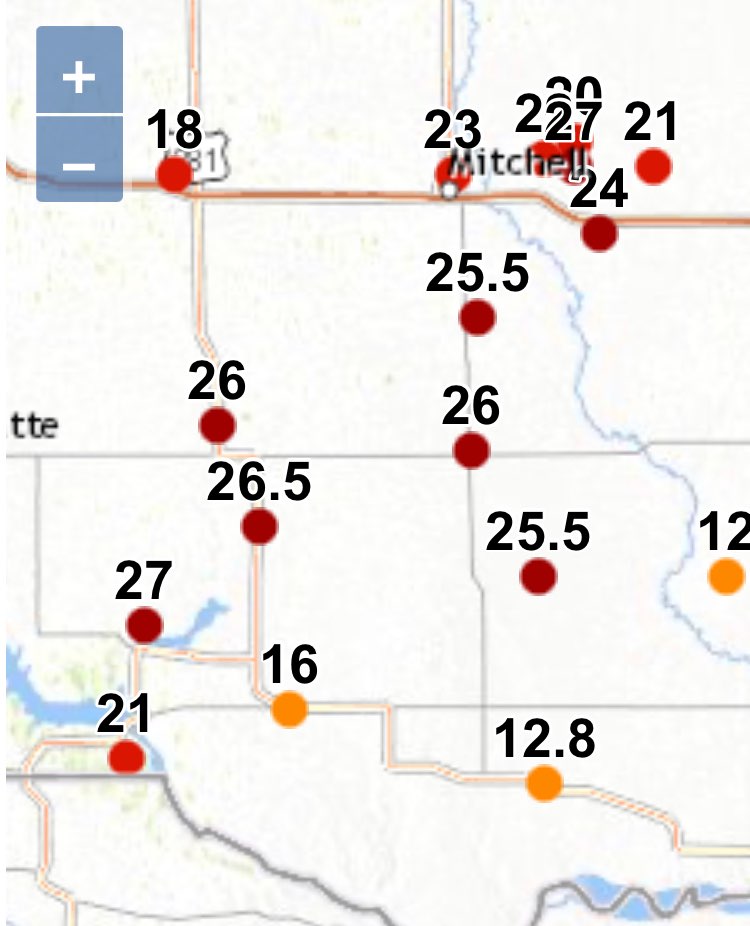
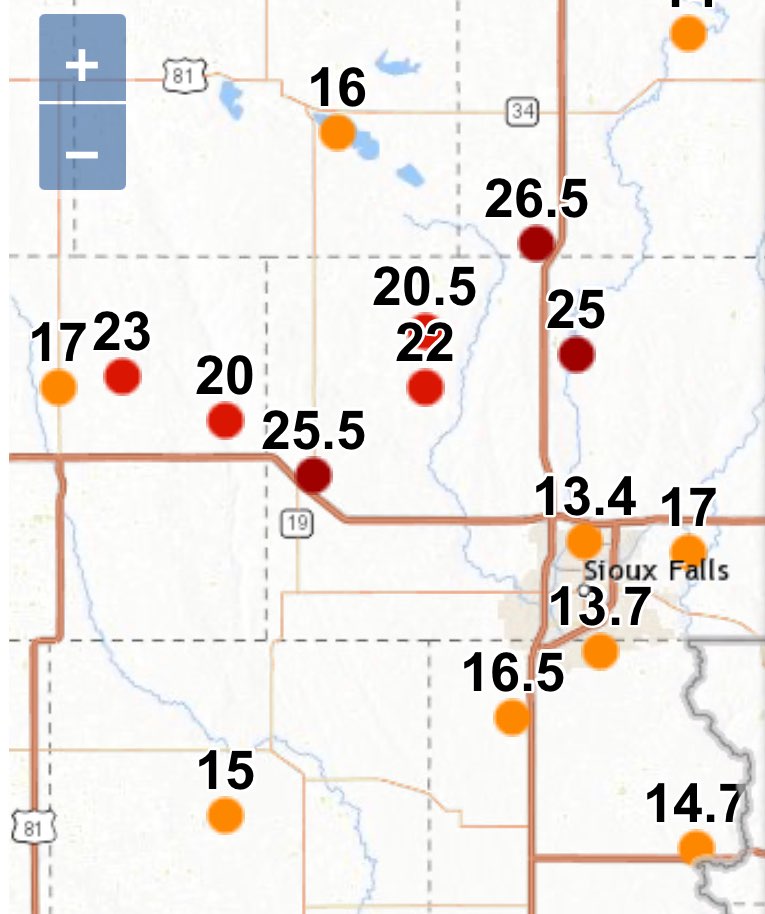
Talked to my dad who lives in a little town outside of Mitchell SD. Said they received 25” of snow.
Plows worked on the roads but most are only one lane.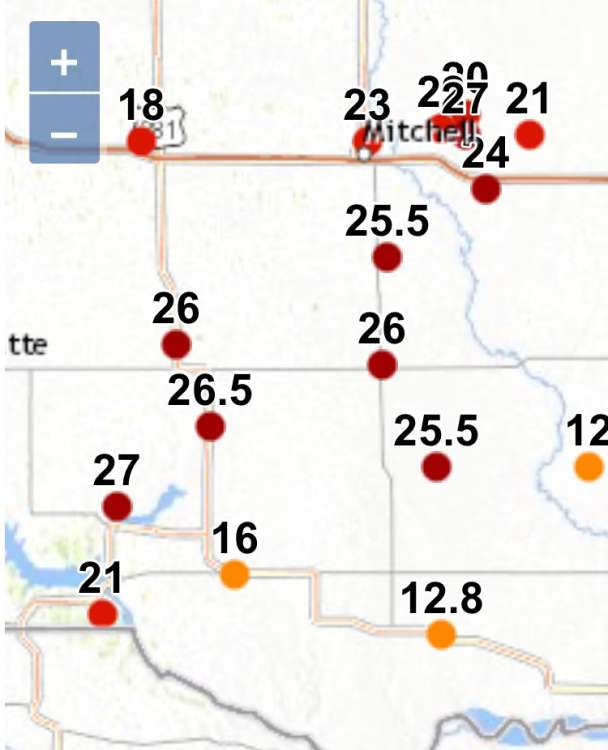
-
3
-
2
-
-
-
-
Daddy- what’s snow?
-
2
-
2
-
1
-
-
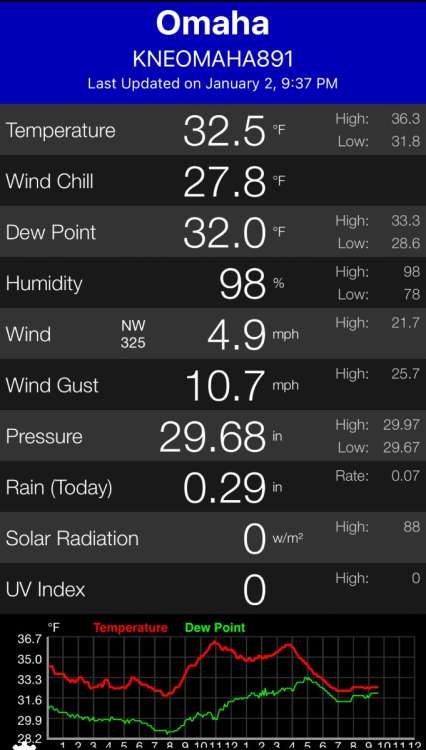
The best kind of weather you can get with a big storm system

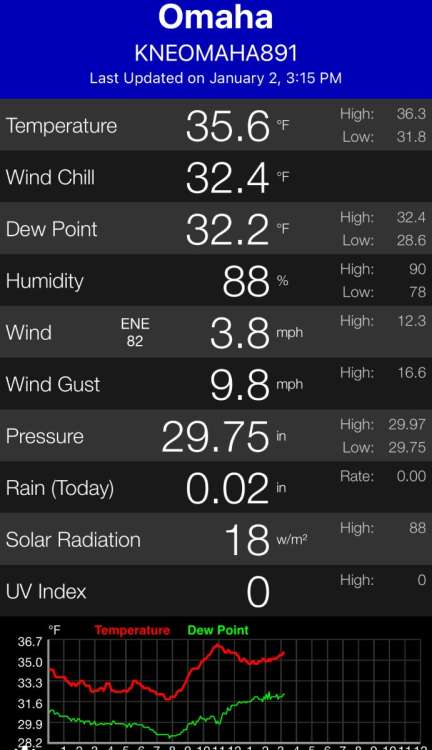
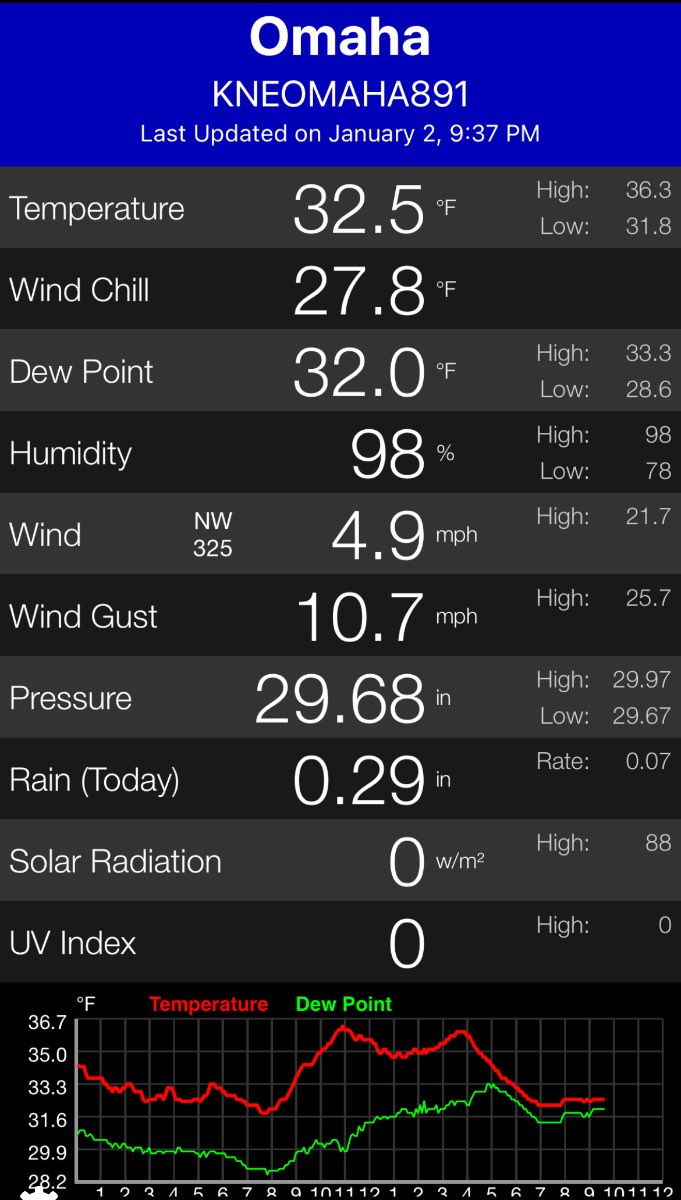
32.5 degrees and raining.

-
 2
2
-
-
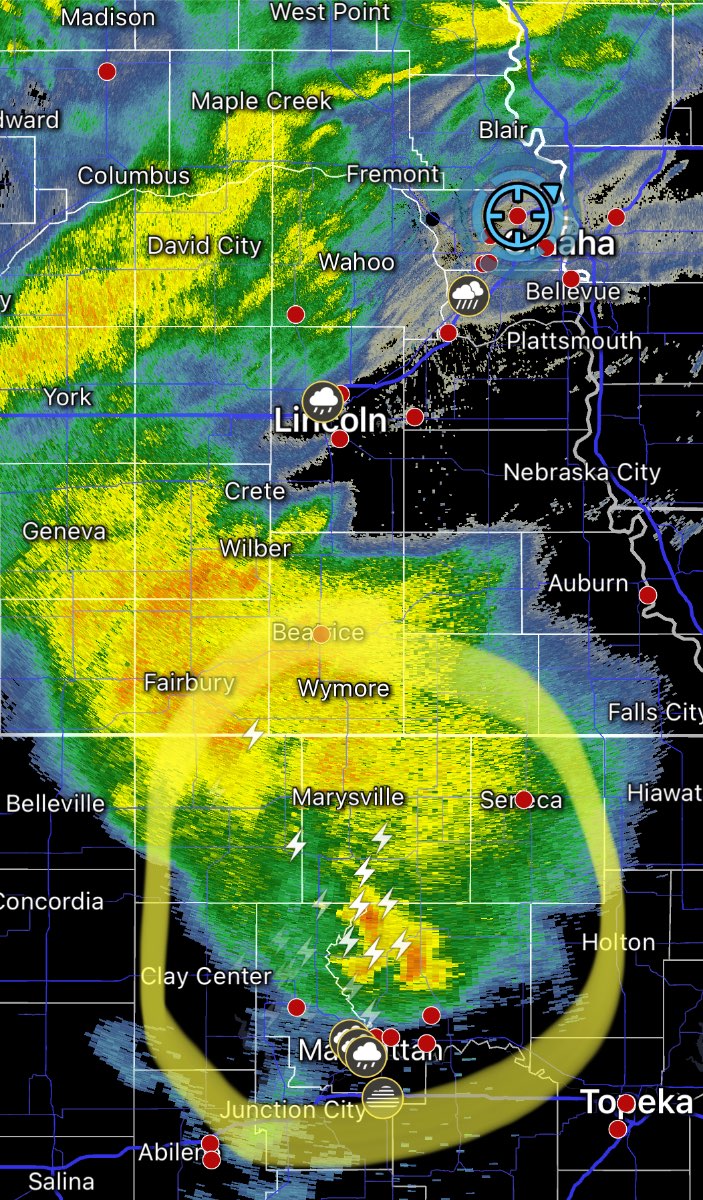
Already .02” of a cold 35 degree rain has fallen.
Now to wait for the tstorms in Kansas to try and make it here.

-
 1
1
-
 1
1
-
-
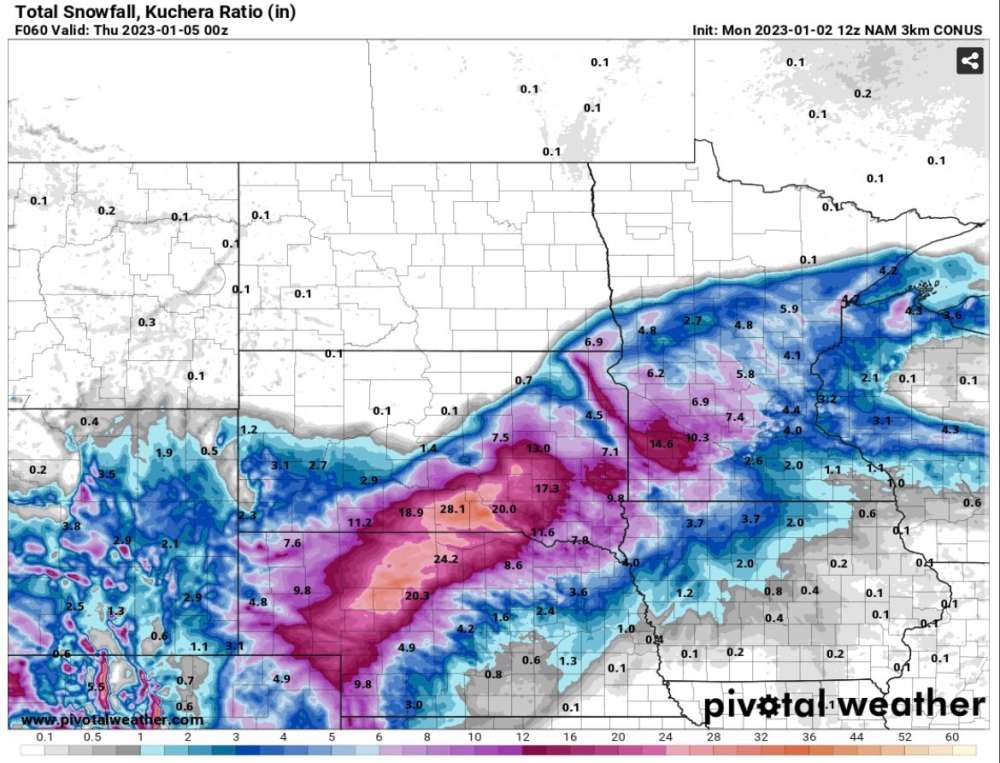
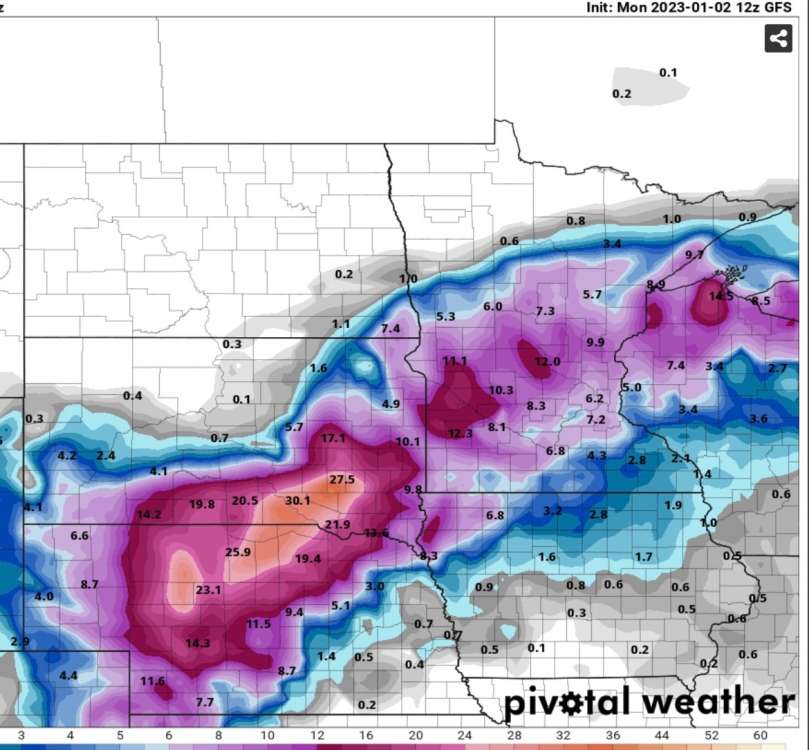
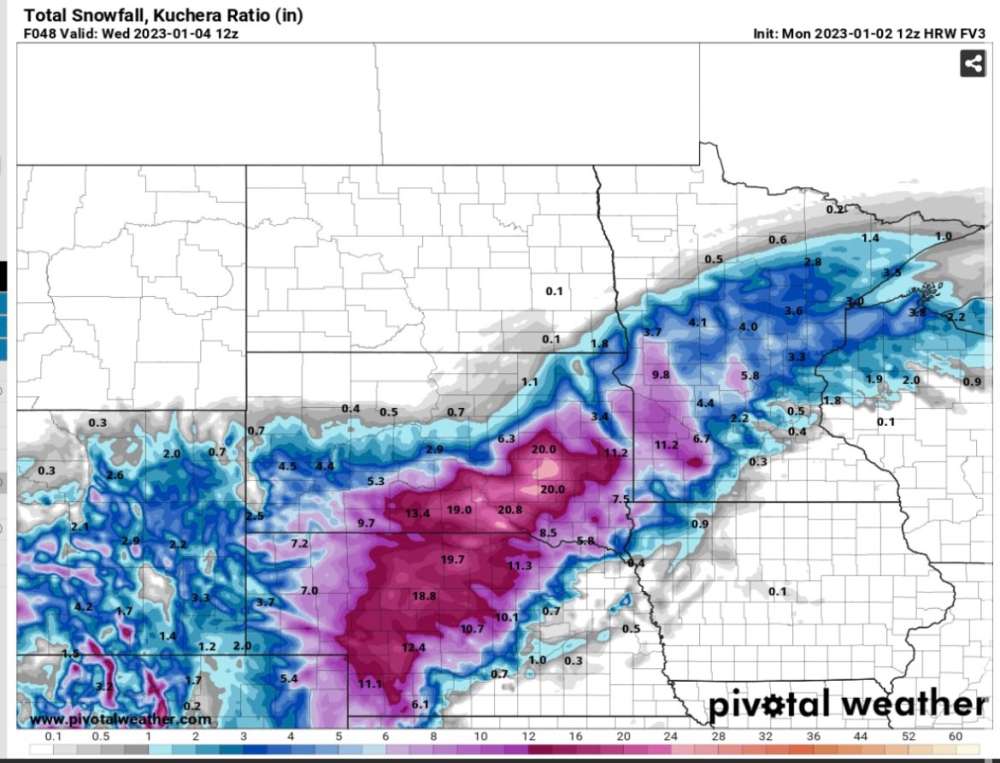
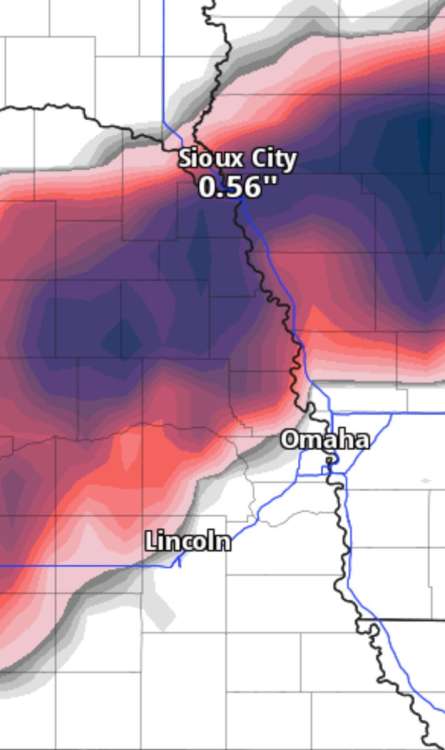
Interesting how the 12Z models have shifted everything back northwest…
South central SoDak and north central Nebraska seems to be the target now.
Meanwhile I’m in my 3rd winter weather advisory this season for less than 1” of snow and a light coating of ice.


-
2
-
1
-
-
Sigh…

-
3
-
1
-


January 2023 Observations and Discussions
in East of the Rockies
Posted