


May Grey
-
Posts
3562 -
Joined
Posts posted by May Grey
-
-
What's your definition of humid? I think even low/mid 80s are gross when dewpoints are in the mid 70s. Instead sweatage.
Interestingly, when I visited Yuma, AZ in July 22nd-July 25th The Dew points would get in the 70's in the morning and it was very windy as well because of the Gulf surge.
July 23nd
https://www.wunderground.com/history/airport/KNYL/2016/7/23/DailyHistory.html
July 24th
https://www.wunderground.com/history/airport/KNYL/2016/7/24/DailyHistory.html
July 25th
https://www.wunderground.com/history/airport/KNYL/2016/7/25/DailyHistory.html
-
It only went above 90F 3 days last year in Orcutt, CA while in 2015 it went above 90F 14 days.
-
I think we will see a very weak El Nino this fall. +0.5-+0.6 in the 3 and 4 region.
-
I have gotten 0.73" of rain today. The rain at times was very heavy, tropical like downpours.
-
 1
1
-
-
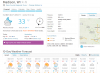
The high temperature today is 82F, it is the 1st 80F+ day of the year and the last time it went at least 80F was back on a November 13th, 2016!
-
The dew point is now 57F, approaching 60 F! Its feels like summer mild monsoonal moisture intrusion.
-
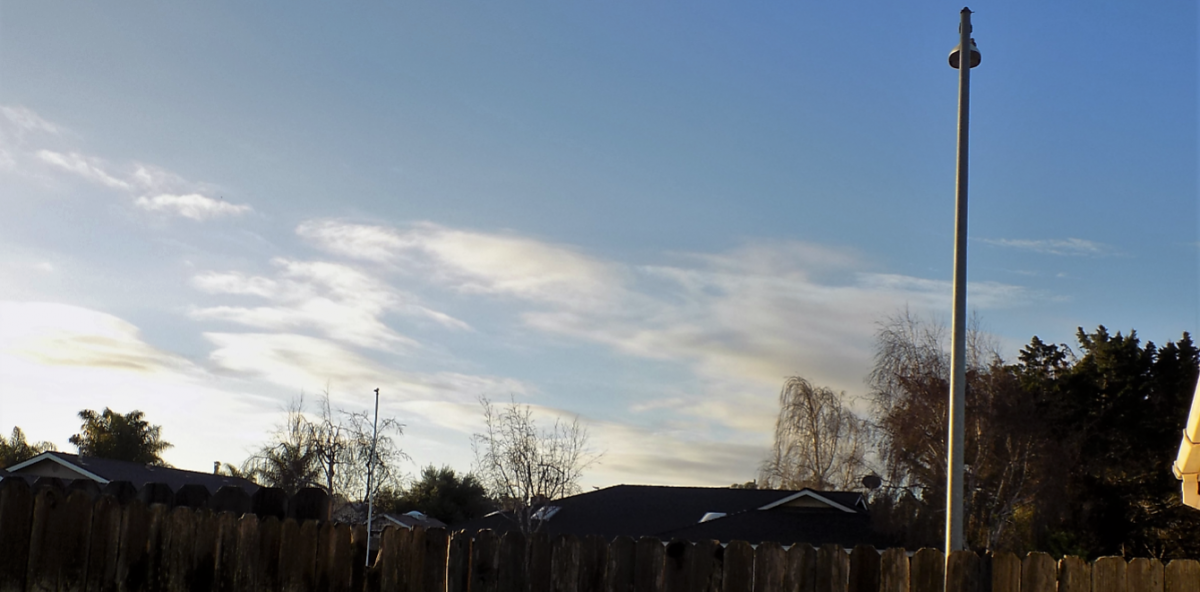
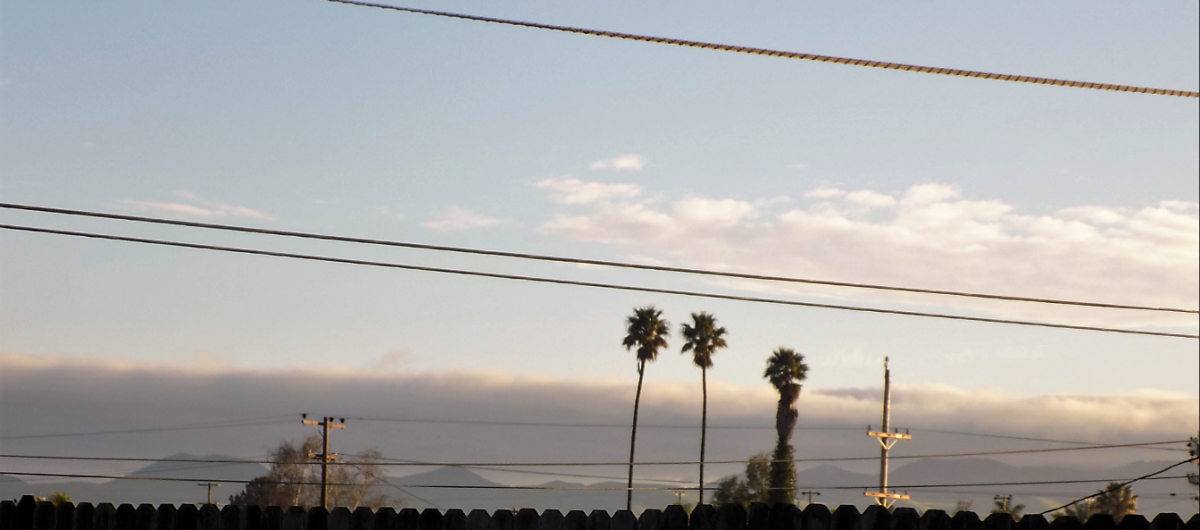
What a beautiful Sunday morning!


-
1
-
-
I have now gotten 18.43" of rain this water year. The annual average is 13.53" (September 1st-Today)
-
1
-
-
Here is my rainfall totals for every month starting September. Its amazing that every month has seen above average rainfall except for September. I'm already above my monthly average rainfall by 2 inches!
Actual | Avg | % of average
Sept: 0.00" | 0.16" | 0%
Oct: 1.39" | 0.58" | 240%
Nov: 1.40" | 1.36" | 103%
Dec: 2.84" | 2.15" | 132%
Jan: 7.00" | 2.64" | 265%
Feb (So far): 2.92" | 2.75" | 106%
Update:
Actual | Avg | % of average
Sept: 0.00" | 0.16" | 0%
Oct: 1.39" | 0.58" | 240%
Nov: 1.40" | 1.36" | 103%
Dec: 2.84" | 2.15" | 132%
Jan: 7.00" | 2.64" | 265%
Feb (So far): 5.61" | 2.75" | 204%
Season to date: 18.24"
-
I had wind gust up to 56 MPH earlier today.
-
2.11" since 8pm last night
-
Very weak La Nina
-
Here is my rainfall totals for every month starting September. Its amazing that every month has seen above average rainfall except for September. I'm already above my monthly average rainfall by 2 inches!
Actual | Avg | % of average
Sept: 0.00" | 0.16" | 0%
Oct: 1.39" | 0.58" | 240%
Nov: 1.40" | 1.36" | 103%
Dec: 2.84" | 2.15" | 132%
Jan: 7.00" | 2.64" | 265%
Feb (So far): 2.92" | 2.75" | 106%-
1
-
-
Dam! (Pun intended) Its going to rain at least 7 days in a row!
-
CPC is likely going off of CFSv2 trends for their monthly outlook for February. The latest 10 day trend suggesting a colder/wetter overall look for the sub forum. The model has done fairly well for Dec/Jan trends. This leads me to believe the storm track will be shunted farther south next month along with other important factors.
http://www.cpc.ncep.noaa.gov/products/CFSv2/imagesInd3/glbz700MonInd1.gif
http://www.cpc.ncep.noaa.gov/products/CFSv2/imagesInd3/usT2mMonInd1.gif
http://www.cpc.ncep.noaa.gov/products/CFSv2/imagesInd3/usPrecMonInd1.gif
CPC has been wrong all season with the California precip forecast. They had predicted a very dry January for California.
-
Now having these pop up heavy rain showers
-
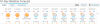
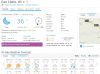
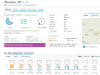
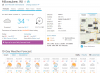
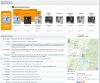
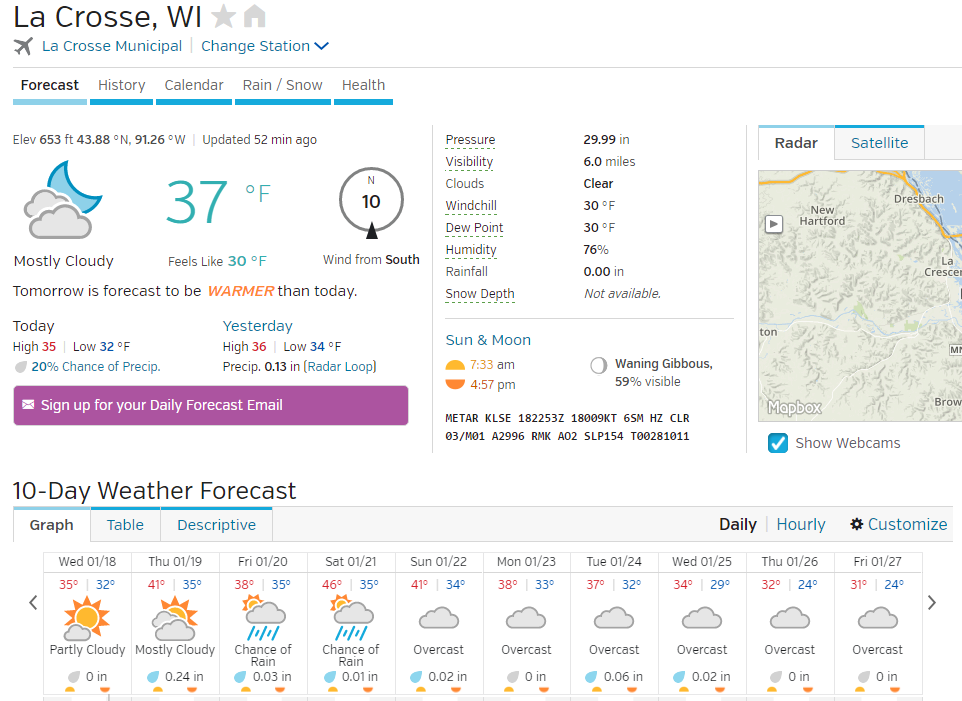
What website is this info from? I like the layout and graphics.
wunderground.com
-
The latest JAMSTEC has a weak Nino during the summer months and trends cooler by next Winter...
http://www.jamstec.go.jp/frcgc/research/d1/iod/2007/forecast/ssta.nino3.4.fcst.2-yr.1jan2017.gif
Summer months....
http://www.jamstec.go.jp/frcgc/research/d1/iod/2007/forecast/ssta.glob.JJA2017.1jan2017.gif
Autumn...
http://www.jamstec.go.jp/frcgc/research/d1/iod/2007/forecast/ssta.glob.SON2017.1jan2017.gif
The weakest and shortest El Nino ever? I'm not sure if an El Nino will develop this year?
-
Forecast looks very cloudy and maybe some snow in Wisconsin next week.
-
Wow!
http://www.wpc.ncep.noaa.gov/qpf/p168i.gif?1431475333
-
Freezing rain, Heavy rain and then snow, that sounds like flooding to me. The CDA-Post Falls area will get crazy weather this week. Especially with that heavy snowpack up there.


-
1
-
-
Near consistent onshore flow has made it difficult to attain cold minimums this month. Statistically average mean temps actually rise in January [60.6°] making December [59.5°] the coldest month.
How did Santa Maria fare during recent storms? Above normal rainfall?
I'm at 9.47" of rain this water year so far (Sept 1st-Aug 31st) Which is between 150%-200% of average so far. I'm only around 4 inches away from my annual average.
-
1
-
-
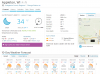
It is a currently a chilly 33F
-
More rain will continue after the break.

http://www.cpc.ncep.noaa.gov/products/predictions/610day/610prcp.new.gif


2017 California/Southwest Weather Thread
in West of the Rockies
Posted
With 21.63" of rain since September 1st, This is now the 7th wettest water year on record!