


Jayhawker85
-
Posts
300 -
Joined
-
Last visited
Posts posted by Jayhawker85
-
-
11 minutes ago, Clinton said:
The same system produced a nasty tornado outbreak from Ark to Ky. I would expect something similar this time in the region a little further SE based on the amount of cold air the GFS is showing from time to time.
from Gary blog this morning:
The LRC look into the rest of this month: A stormy stretch with a chance of a winter storm or two will increase between Feb. 15 and 20, with a series of storm systems likely in the second half of this month. This is one of the signature parts of the pattern that has produced strong storm systems in the previous two cycles. The Mayfield, Kentucky tornado disaster happened in the December version of this year's cycling pattern. That part of the pattern will cycle back through in around 10 days. In the February and March versions of the LRC, there is often cold air still available and these later storm systems will likely have a strong winter and possibly the spring severe weather effects on the pattern. I am expecting a major winter storm with tornado potential in the warmer air farther south and east.-
 1
1
-
-
12 minutes ago, mlgamer said:
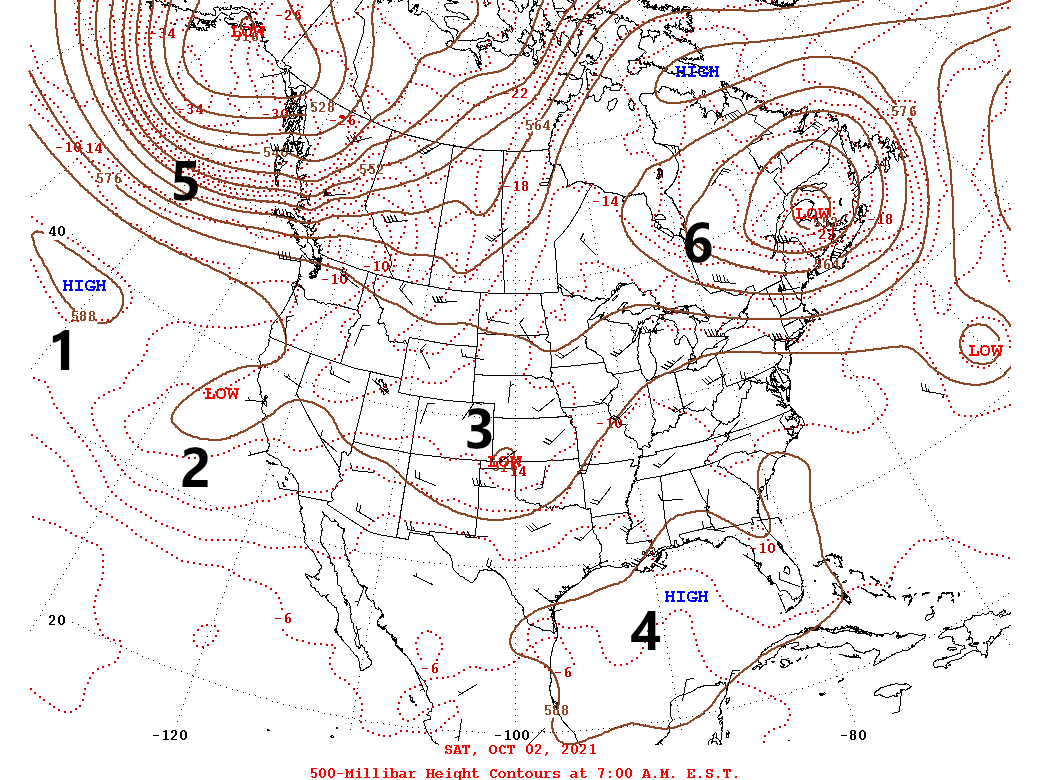
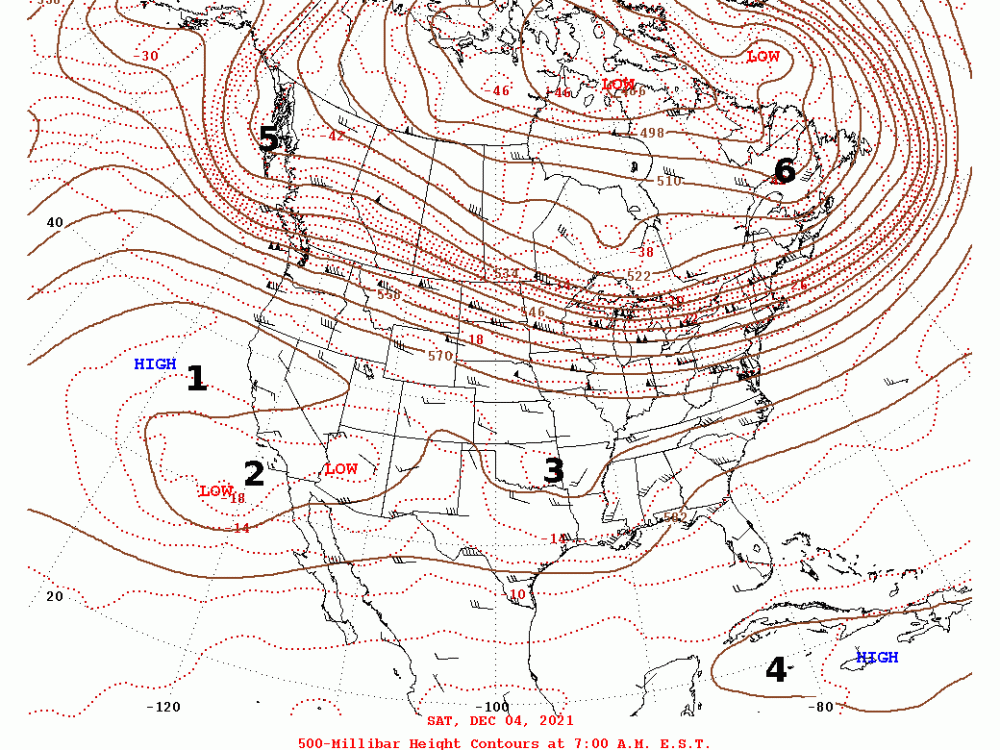
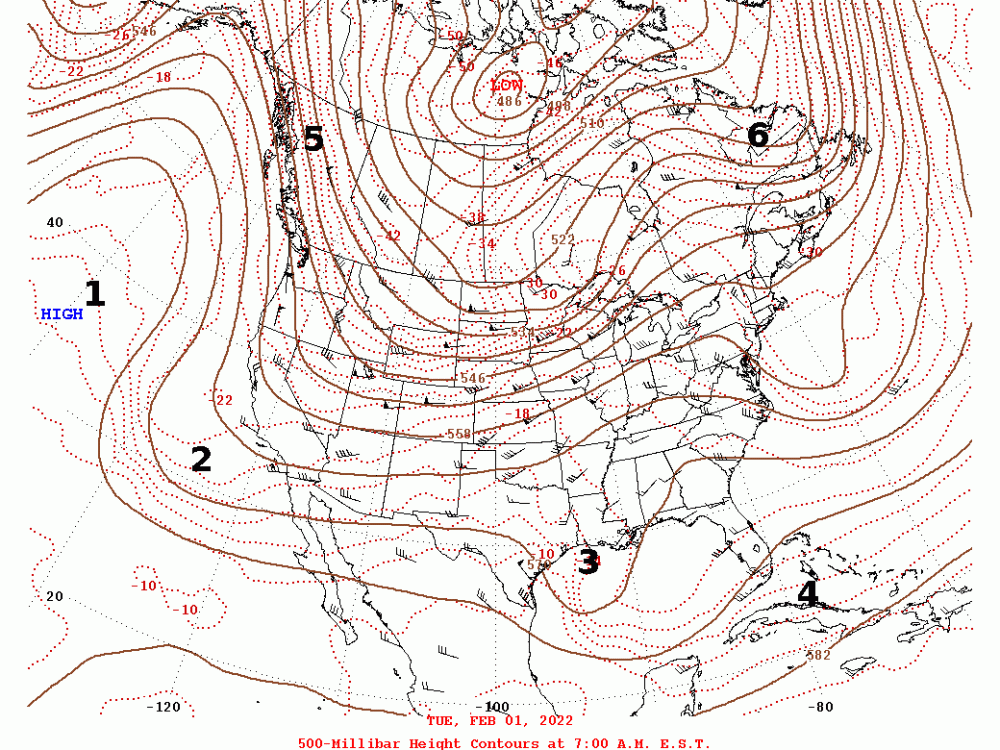
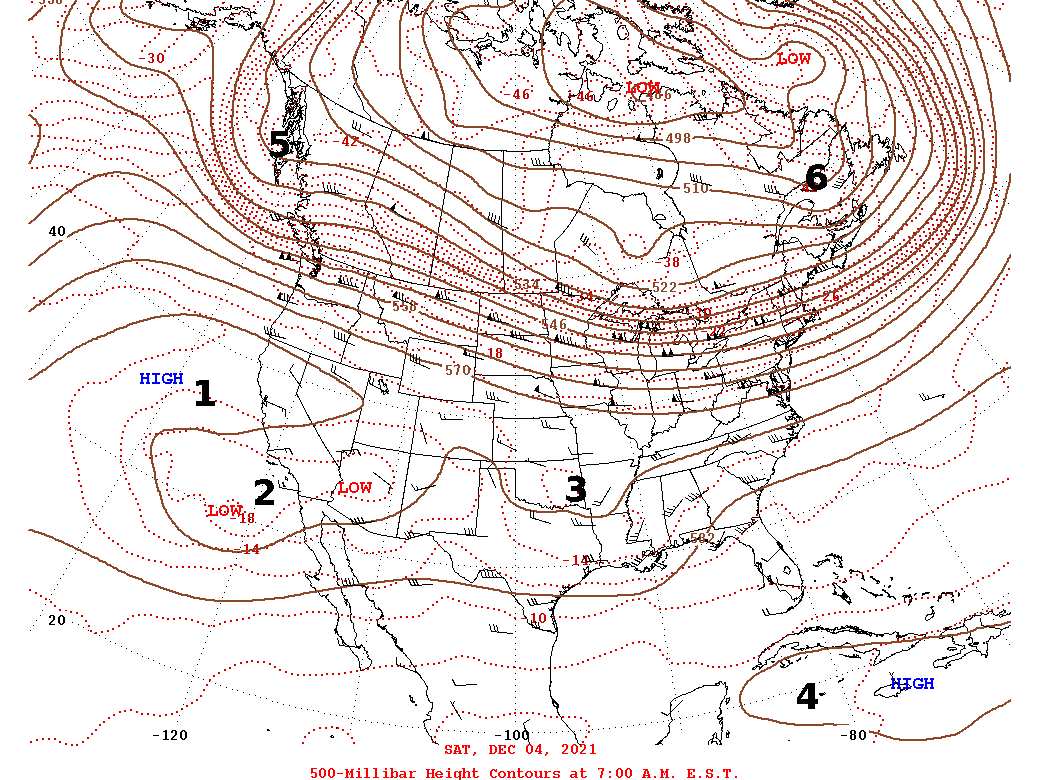
I'm not taking a position either way, but I put this together just for discussion for anyone interested. So do these maps reflect a discernible cycle? I'm guessing Gary says they do. (I added the numbers to the Dec and Feb maps.)
Oct 2 (Gary's map)
Dec 4 - 63 days
Feb 1 - 122 days (61 day cycle - I think this map sorta matches, note the extension east of New Jersey is similar to Oct 2)
Feb 3 - 124 days (62 day cycle - Gary's blog matched this date with a GFS forecast map)
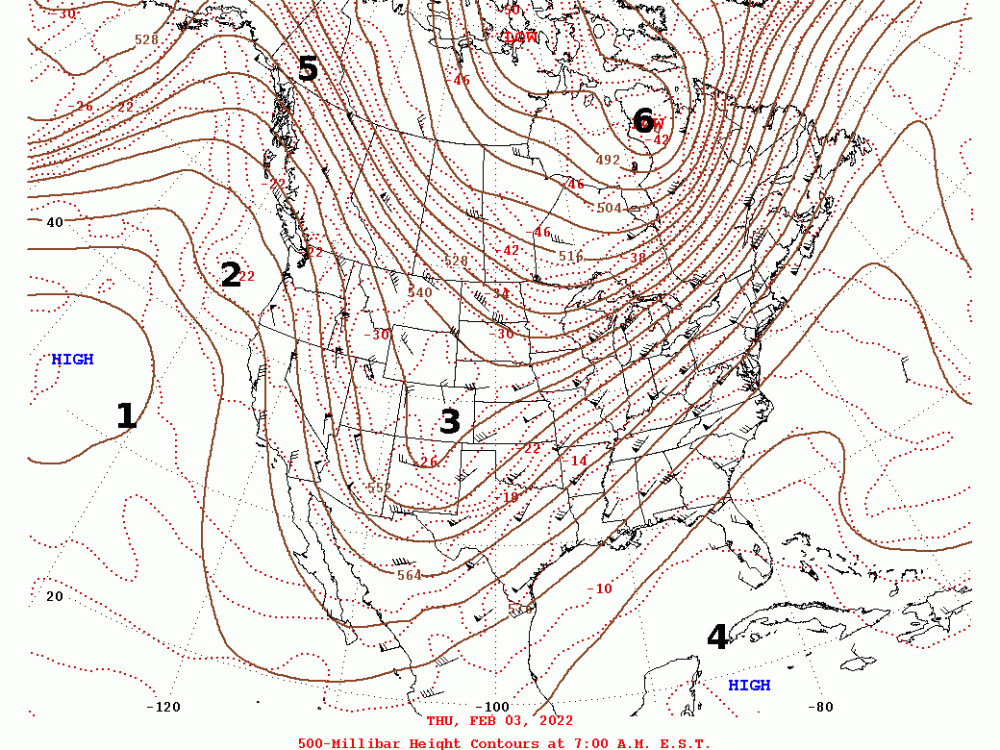
This here shows that there is a pattern and a cycle. I think people do not take into consideration the seasonal differences. Just like there are long term patterns where storms strengthen and patterns where storms weaken. Just like how everyone on here knows that the month of October was wet and active for the Midwest and central part of the country and not so much on the east coast which is the pattern we are entering now. The month of November was known for Great Lake clippers and big storms on the east coast what just happened the last couple weeks.
i think there is a pattern and cycle to the chaos in the atmosphere it’s just not the exact same return/location when it cycles back thru. I agree the LRC is not 100% perfect but it’s the best long term forecasting tool over the GFS and other long term forecast tools
-
5
-
-
13 minutes ago, Clinton said:
Good blog today from Garys weather team about the upcoming pattern and the LRC for those interested.
https://www.kshb.com/weather/weather-blog-the-next-chance-of-a-winter-storm-is-use-the-lrc
I just saw this after i posted about it
 but yes it was a great read today!
-
1
-
-
Gary’s blog had a great write up about the cycle and when the next big storm will arrive.
•cycle length is 61-66 days for a average of 63.5 days
•every other cycle mirrors each other so this will be the wetter cycle
• this week storm is related to the pattern on 10/2
• the next major storm to watch is 2/17 which is 64 days from the 10/2 storm
-
1
-
-
Have about 3 inches here in lawrence with very light snow. We could of had double but the darn dry slot showed it’s ugly face for several hours last night
-
3
-
-
Lawrence is reporting a mix already
-
3
-
-
1 hour ago, mlgamer said:
The SREF plumes continue to rise for me. 15z had a mean of 12.37"!
I don't know how much that's worth in the grand scheme of things, but there it is...
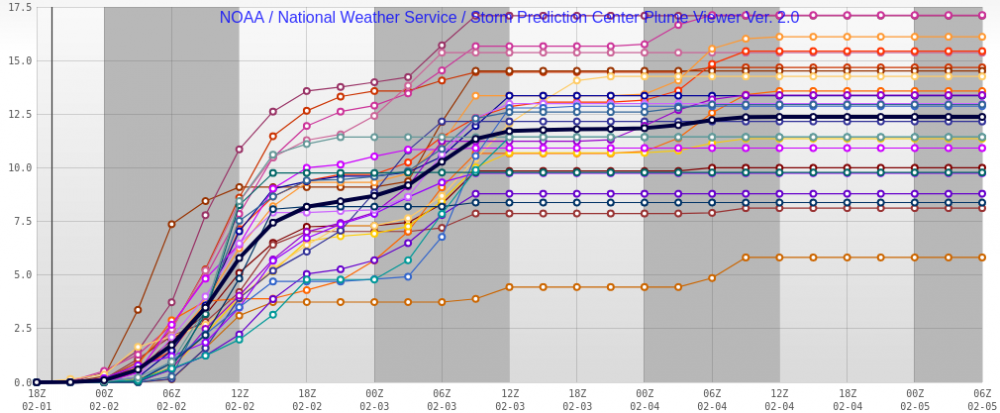
I hope your rates continue to increase as that will ensure i will get hit pretty hard as well
-
1
-
-
7 minutes ago, Clinton said:
18z NAM

This is a crazy divide in the area. Topeka may get 4 while 60 miles East kc gets a foot! Wow!!
-
1
-
 1
1
-
-
10 minutes ago, Clinton said:
12z Euro a little more juiced and a little better for Chicago.

KC

Chicago

Detroit

So pretty much it’s the Euro/Canadian/icon on one team and the GFS/NAM on the other. The battle is on!
-
1
-
-
9 minutes ago, mlgamer said:
The models are drying me out and I'm still sticking with my 2-3" forecast from yesterday.
The models teased us so good for days just to back out in the last 24 hours! Hopefully we can crank out a biggy since we are in the busy pattern later this month
-
2
-
-
2 minutes ago, Tom said:
12z GFS...
This is just getting drier and drier for us

-
 1
1
-
-
1 hour ago, Clinton said:
6z Euro


Let’s pray that the Euro and the short range models are correct for us!! This storm is just like a Chiefs game where we are up by 18 and now the opposing team is caught up and we are about to enter overtime!
-
2
-
-
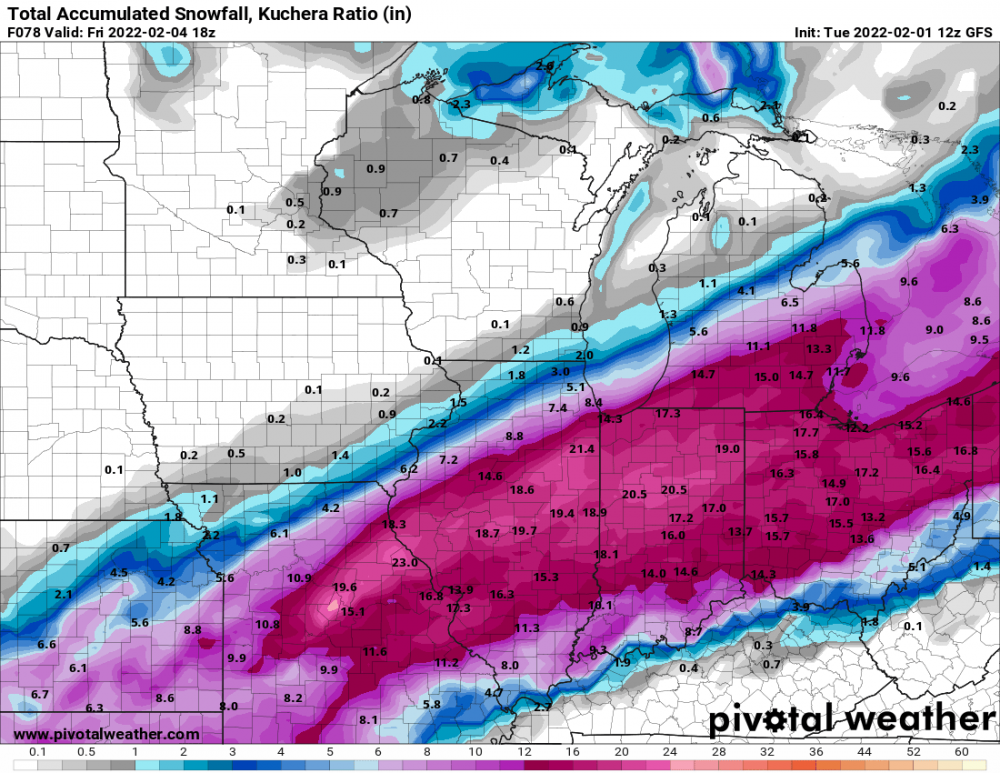
24 minutes ago, Clinton said:
Updated snowfall map from EAX

I will be content with 6-8 but i would greatly prefer 15 lol
-
2
-
 1
1
-
-
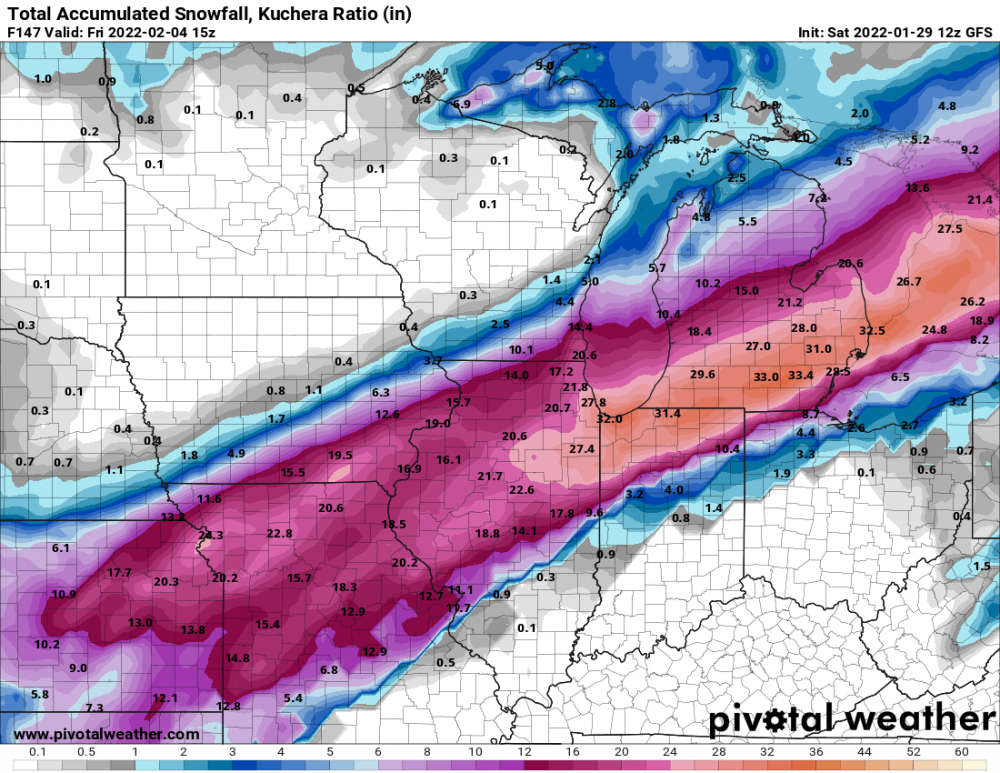
6 minutes ago, Clinton said:
0z models should have a good handle on that second wave. You look good for a warning level snow imo.
Yeah but each run they keep getting lower and lower. Yesterday it was showing 22 inches and today maybe 10

-
18z GFS - first wave looks like it’s a little further north but the 2nd wave gets suppressed to the south due to the high pressure
-
2
-
-
22 minutes ago, Clinton said:
12Z GEFS has about a 20 mile south shift. 10:1 map


I’m scared with these southern trends. Hopefully it’s just a glitch today and they will nudge back up north tomorrow. Crossing fingers and toes!
-
1
-
-
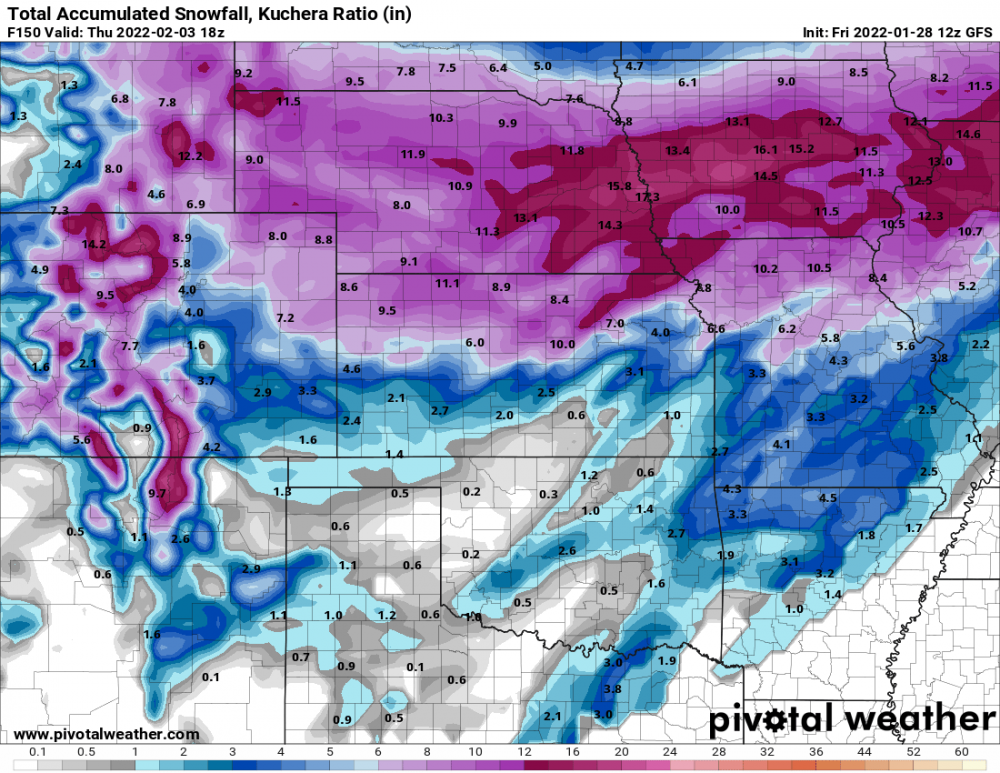
5 minutes ago, Clinton said:
12z NAM less juiced

Gary is being SUPER conservative with snow totals. His forecast this morning is 2-3 inches but all the models are showing 10+
-
 1
1
-
-
1 hour ago, Clinton said:
6z Euro

I’m sooo happy that we and the kc peeps are finally getting a major storm that we can be fully excited about!!
im glad that my winter prediction in November came true for us to have a backloaded winter and she is showing up right on time!
-
2
-
-
7 minutes ago, someweatherdude said:
For my little corner of the world, the GFS actually moved back to the NW just a tad. Only about 15-20 miles though.
We need every little push NW that we can get over the next 48 hours
-
2
-
-
2 minutes ago, Clinton said:
GEFS dips further south but the ensembles indicate that the south shift may be about to stop.


I hope so as this is getting too close to become a dud for us what was once promising 12 hours ago
-
1
-
-
14 minutes ago, jcwxguy said:
Wow!!! Imagine if we get 20 inches!! I need to start warming up on all the snow angels I’m going to be making lol
-
1
-
1
-
-
22 minutes ago, Clinton said:
0z ICON has 2 waves like the 18z GFS absolutely buries KC and Chicago

This would be a epic dream!!
-
2
-
-
Just now, mlgamer said:
LOL...12z GFS sets up the standard I-70 screw job!

I'll see where things stand Tuesday. I've seen this show too many times already.
It’s still 5 days out. Per yesterday the high pressure was too strong and pushed it all to I-70 and now today the high pressure is weaker and further north lol
-
5 minutes ago, CentralNebWeather said:
12z GFS through 150 hours
This is quite the flip from the runs earlier that had this over ks and Mo. let the model battles begin!
-
1
-


2/16 - 2/18 Plains/GL's Cutter
in East of the Rockies
Posted
The models go wet to dry and will go wet again in the day or so. This storm per the previous cycle was negatively titled and produced a lot of moisture. I expect this to be a true precip performer once the models sample the energy and moisture once it’s onshore. We are still 5 days out from when it arrives