

Brian_in_Leavenworth
-
Posts
3545 -
Joined
-
Last visited
-
Days Won
7
Posts posted by Brian_in_Leavenworth
-
-
Some CPC maps. Nothing surprising, but some interesting years on the analog maps.


-
 1
1
-
-
Nice SE ridge too. And is that a kona low? Not sure if I am seeing that right.
-
1
-
-
-
It's not a pattern that is likely to deliver super cold air or big snows, but can over perform at times. Early December 1992 for instance was pretty decent.
Good pattern for the mountains though and I would also get some snow too. I think DJ posted one of these last night with a very low correlation score, so good to see increasing chances of a real pattern change
-
00z GFS Analog Composite - Day 6-10, 8-14. Pattern change to come looks like La Nina taking hold. Chilly, wet, tons of Mt. Snow.
Day 6-10
Day 8-14
Pretty impressive correlation scores for the 8-14 day period
-
2
-
-
Looks like Whatcom County and the BC Lower Mainland gets in on the snow in this run

-
2
-
-
The precursor signals I look for are all present, the only thing holding me back from going balls to the wall bullish for a major SSW is the timing..it’s very early, especially given the embryonic stage of the cycle of easterly shear..it’s just reaching 30mb now.
Then again, the 1980s-2000s were a different era in terms of the BDC/O^3 content, so perhaps that climo for QBO doesn’t work anymore. All I know is, if we rip the PV apart by New Years, it will be essentially unprecedented for the current QBO structure in the modern era, and all bets re: analogs, are off. Oh, and it be cold in a lot of places.
I mentioned last night that Ventrice had studied where the SSW event is can tell us where the cold goes. Based on the map he had, and this possible event, it looks like it would be in a good place for the PNW. What are your thoughts on that?
-
First time I have seen the Euro with snow "in my backyard"

-
2
-
-
Good 48 hour trend from the Canadian ensemble. This is from hour 312
-
6
-
-
Day 10. Compare it to day 10 from the 12Z (of course that would be hour 252).


-
1
-
-
Day 8
 [/quote
Obviously not as good as GFS, but much better than previous runs
-
1
-
-
I took down an earlier post of a twitter from Ventrice showing what happens BEFORE a SSW event. Confusingly, to me, he said SSW events over Siberia are typical of El Nino, and the opposite over the North Atlantic. Yet this last post I showed from him shows that SSW over Siberia is good for us. This is what I really wanted to post.
-
2
-
-
I was re-giving my talk at #AMS2019 to some colleagues over in Europe this morning and noticed the Siberian SSWE warming composite +14 days after the event show the -PNA whereas during North Atlantic SSWE initiations, you don't get the trough over western North America...

-
3
-
-
Actually both of you are right. 12Z wetter through 6 days, 0Z wetter through 10 days.
-
1
-
-
This kind of thing has happened in November before some of our greatest winters.
Those days happen every winter. Even the greatest, coldest, snowiest winters have days like that. And so do the suckfest winters.
-
1
-
-
It's been awhile. Dry though.
Some interesting years, particularly 2008.
-
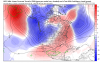
GFS clown range. No arctic air close, but interesting placement of ridge.

-
Interesting trends this morning from the models. GFS giving us a quick cool down and in the clown run trying to build a ridge in the right spot.
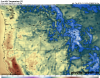
Canadian day 10:

-
This year the lawn was firm after a few freezes and it was dry outside, so I just used the walking mower with the bag behind it and it worked great. Mine is a lithium battery mower that is fine for my size lawn and is quieter than gas mowers. Got all the leaves from the yard.
-
That should begin to help cool the blob. C'MON!!!!
00z GFS in 8 hours 6 minutes
Like I said before, the "blob" is not a bad thing, if it is in the right place. A negative PDO features a warm blob below Alaska (except just south of the coastline) The blob of a few winters ago was hugging our coast (positive PDO). The current PDO is -0.45
http://research.jisao.washington.edu/pdo/pdo_warm_cool3.jpg
-
2
-
-
-
The PDO dropped down to -0.45 in October, way down from 0.41 in September. BTW Nate Mantua is not at the UW, the PDO page that he used to update there no longer updates. He is at swfsc.noaa.gov. and that is where you can find the latest pdo updates
-
1
-
-
And the same hour on pivotal. Different temps for sure.There is a 6-hour max temp map on WB. And it usually runs 3-4 degrees too cool.
Using your example... here are the high temps on day 9 on WB:

-
1
-
-
Just a thought about the temperature maps. Looking at day 9 on the Euro, for example, it shows at 4PM, which would be close to the high for the day, temps in the mid 40s for Bellinghm, upper 40s for Seattle, mid 30s for my area, and 50 for Portland. That seems to be at or below normal. Definitely below normal for Bellingham and for my area. BUT the map says it is 11 degrees above normal for Seattle, implying that it is normally about 38 for a high on November 22nd. 3 degrees above normal for Wenatchee, meaning the normal high for Nov. 22nd is 32.
And 6 degrees above normal for Bellingham, meaning that their normal high is 38 or 39. All are obviously false, so where in the hell do they get their anomaly maps?


November 2019 Weather Discussion for the PNW
in West of the Rockies
Posted
Now the 8-14 day maps. They do say confidence in the 8-14 day forecast is below average.