Brian_in_Leavenworth
-
Posts
3545 -
Joined
-
Last visited
-
Days Won
7
Everything posted by Brian_in_Leavenworth
-
November 2017 PNW Discussion Thread
Brian_in_Leavenworth replied to stuffradio's topic in West of the Rockies
And to be fair to Phil, people in the PNW never have to worry about hurricanes. -
November 2017 PNW Discussion Thread
Brian_in_Leavenworth replied to stuffradio's topic in West of the Rockies
Found this here http://www.summitpost.org/interesting-weather-statistics-for-us-mountain-summits/171585 Now, to be fair, the Rainier data is for the summit, where nobody is really there, except briefly for climbers, where Mt. Washington is much more accessible, and there is a full time crew at the Observatory. And Rainier's data is interpolated from actual data coming from Camp Muir. "Unfortunately, wind speed data is hard to obtain for most of these mountains. Of all these mountains, Mount Washington is the only one with long term wind data. Other than wind data for Mount Washington, I could also find it for Pikes Peak, Mount Evans, and Longs Peak in Colorado, plus Camp Muir in Washington. Longs Peak and Mount Washington are about the same in wind speed and both are significantly windier than Pikes Peak. Mount Evans compares fairly well with Longs Peak and Mount Washington, but the extreme wind speeds are much lower. Mount Rainier might be the windiest place in the lower 48, but average wind speeds come from an interpolation, rather than measured data. Mount Washington had a record wind gust of 231 mph in April 1934. Longs Peak had a record wind gust of 201 mph in 1981, but the station only lasted a short time. During the period of record, Pikes Peak had an estimated maximum wind gust of 150 mph, but the anemometer blew away 112 mph. Mount Evans has recorded wind speeds of 123 mph (some sources report a gust of 150+ mph, but I can't find when this was recorded), which is significantly less than that of Mount Washington or Longs Peak, but the period of record for the maximum wind gust was only 1994-1996. Had the period of record been longer, the maximum wind gust would likely be higher. 2000 feet lower than Longs Peak, Trail Ridge, north of Longs Peak has recorded gusts of 157 mph, also in 1981. Hidden Peak (Utah) next to Mount Baldy has recorded wind speeds of 124 mph, but wind readings are only taken sporadically. Supposedly Grandfather Mountain recorded a 200 mph wind gust in January 2006, but this is not an official figure since the roof of the building on which the gauge was placed was suspected to have an amplifying effect. The highest official wind speed on Grandfather Mountain was 121 mph in December 2012. Computer models have predicted that maximum wind gust on Denali have exceeded 300 mph (such as during the storm that wiped out the Wilcox Expedition), but of course such a figure is a calculated estimate rather than an actual measurement. Unfortunately, Long Peak doesn’t have any temperature data compiled; only wind, so wind chills are hard to compare. More than likely, Long Peak is similar in temperatures to Pikes Peak, but a few degrees colder. The Camp Muir data comes from actual data from the weather station at Camp Muir, but no period of record is given. The Mount Rainier wind data is an interpolation of the Camp Muir data. Grandfather Mountain must have data for average wind speed somewhere, but I have been unable to find it. It seems no wind data is available for the other summits listed below. It would be interesting to see how windy the other high peaks in the Cascades or California are compared with the Rockies or Appalachians. Peak Average Wind Speed Mount Rainier 36.3 Mount Washington 35.3 Longs Peak 34.3 Mount Evans 31.5 Pikes Peak 21.2 Camp Muir 20.5 -
November 2017 PNW Discussion Thread
Brian_in_Leavenworth replied to stuffradio's topic in West of the Rockies
http://mynorthwest.com/424892/was-windstorm-2016-overblown-exaggerated/
-
November 2017 PNW Discussion Thread
Brian_in_Leavenworth replied to stuffradio's topic in West of the Rockies
I don't take much stock in really long range models, and this is ridiculously extreme, but just for fun, here is last nights 18Z CFS run for December.
-
November 2017 PNW Discussion Thread
Brian_in_Leavenworth replied to stuffradio's topic in West of the Rockies
Good tweet from Michael Ventrice this morning, sorry I dont know how to embed the full twitter with images, but here is what he said: "Interesting conundrum between the ECMWF and CFSv2 weeklies; CFSv2 not buying into prolonged -NAO episode like ECMWF. Instead, model reverts back to La Nina/+NAO pattern that can bring anomalous warmth across the East. This will be worth watching"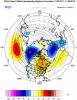
-
November 2017 PNW Discussion Thread
Brian_in_Leavenworth replied to stuffradio's topic in West of the Rockies
Not meaning this for states other than the PNW, since this is a Western forum, so mainly Oregon and Washington, and there already is a California thread. Maybe BC if they want that. -
November 2017 PNW Discussion Thread
Brian_in_Leavenworth replied to stuffradio's topic in West of the Rockies
I think during an actual event that it would be a good idea to have a separate topic by region. Or to have separate topics by events, like "Portland (or Seattle) snowstorm December 15th, 2018". But I like having one main topic to get the big picture until something happens. Unless we want to have Oregon/Washington separate topics by observed weather, but still have the main monthly topic for the big picture. -
November 2017 PNW Discussion Thread
Brian_in_Leavenworth replied to stuffradio's topic in West of the Rockies
So is the control run colder for the PNW than the ensemble mean, or am I reading your original post wrong and the low 500mb heights just means a lot of storms but normal temps? If it did show cold temps for us, it is different than the ensembles, so probably the ensembles would be more accurate? Not sure how the really long range models work. -
November 2017 PNW Discussion Thread
Brian_in_Leavenworth replied to stuffradio's topic in West of the Rockies
Phil, saw this on Twitter. What is the difference between this and what you showed? Is this the main model run?
-
Interesting winter prediction here: http://m.uploadedit.com/bbtc/1509722707103.pdf A lot of talk about where the North Pacific Ridge will end up for most of the winter, and how to predict that. A lot of that is based on QBO, etc. He has December, February, and March (Washington/North Idaho only for March) to be the coldest relative to average, and January about average. Here is an excerpt, you will have to click on the link to see the whole thing and the images: Forecast Discussion North Pacific Pattern 1. When the Jul to Oct AAM averages negative in concert with Cool ENSO conditions (Negative Neutral & La Nina), a 500mb high pressure ridge is strongly favored to exist in the North Pacific in the subsequent mean winter pattern (26 of 27 cases via AAM data back to 1958). 2. The location and configuration of the Cool ENSO North Pacific Ridge has a large influence on the weather pattern over North America. For the Cool ENSO winters that contained a North Pacific Ridge in the mean winter pattern (34 of 38 cases since 1949), I binned the winters based on the relative position of the ridge, i.e. whether the ridge was located in the ‘relative’ NW, NE, SW, or SE portion of the North Pacific." 3. The key takeaways from those images: a. The “North” North Pacific Ridge cases allow for meridional flow out of the Arctic on the east side of the ridge, with the U.S. temperature distribution having a general cool north / warm south configuration. b. The “South” North Pacific Ridge cases are subject to west to east zonal flow on the north side of the ridge, cutting off the flow out of the Arctic, and have a general U.S. temperature distribution of cool west of the Rockies / warm east of the Rockies. 4. The next obvious question is, how do we predict the specific location of the North Pacific Ridge during Cool ENSO winters? a. Anthony Masiello’s (Twitter: @antmasiello) findings from 2012 showed that “North” North Pacific Ridges are favored during La Nina / +QBO winters, while “South” North Pacific Ridges are favored during La Nina / -QBO winters. Anthony noted that designating the winter QBO phase was heavily weighted toward the lower layers of the stratosphere (i.e. 40mb – 50mb). b. The problem this winter is that assigning a QBO designation in the lower stratosphere is more difficult than normal. In the 40mb to 50mb layer, we will have a +QBO transitioning to -QBO. The best comparisons among Cool ENSO years for the current QBO progression on the Berlin QBO chart would be the winters of 83-84 and 00-01. The winters of 62-63 and 81-82 were also similar, but with an earlier progression into the QBO phase; while the winter of 11-12 was similar, but with a later progression into the QBO phase. i. Neither the 83-84 nor the 00-01 winter featured a high pressure ridge in the North Pacific in a location that is typical of Cool ENSO winters. Instead, both of these winters featured a similar mean pattern of NW Pac Trough / weak NE Pac Ridge / Central & Eastern U.S. Trough. ii. The 62-63 and 81-82 winters both featured a “North” North Pacific Ridge with negative height anomalies across large portions of the U.S. iii. The 11-12 winter featured a “South” North Pacific Ridge, a +AO/+NAO, and positive height anomalies across all of the U.S. iv. When looking at Cool ENSO / -QBO winters, the 500mb pattern tends to differ based on whether the QBO is in the frontend of the -QBO cycle (i.e. either transitioning into the -QBO phase in the lower stratosphere as it will be this winter, or already in the early part of the -QBO phase in the lower stratosphere) the backend of the -QBO cycle. The frontend -QBO winters tend to feature a “North” North Pacific Ridge and central U.S. trough, while the backend -QBO winters tend to follow the aforementioned correlation and contain a “South” North Pacific Ridge c. Another factor I looked at for predicting the North Pacific Ridge location was the autumn 500mb pattern leading into winter. i. The Oct-Nov pattern prior to “North” North Pacific Ridge winters tended to be absent of negative height anomalies in the Bering Sea, Alaska, and NW Canada. ii. The Oct-Nov pattern prior to “South” North Pacific Ridge winters tended to contain solid negative height anomalies in the eastern Gulf of Alaska extending up into portions of the Bering Sea, Alaska, and/or NW Canada. iii. Based on the current Oct 500mb pattern to date, and the ensemble forecast for the first half of November, this factor is also leaning toward a “North” North Pacific Ridge projection for winter since it doesn’t look like we are going to see solid negative anomalies in the mean pattern that extend from the Eastern Gulf of Alaska into the Bering Sea, Alaska, and/or NW Canada. The forecasted pattern for the first half of November favors substantial ridging in Alaska and the Bering Sea. d. Forecasting the West vs. East placement of the North Pacific Ridge i. I looked at autumn tropical OLR and VP patterns during Cool ENSO years, but couldn’t ascertain any clear indicators to help with formulating a forecast for the west vs. east placement of the North Pacific Ridge. ii. Conventional thought may be to assume that a Central Pacific Nina favors a “West” North Pacific Ridge and that an East Pacific Nina favors an “East” North Pacific Ridge. However, for the Central Pacific Ninas, I did not see the data to support this notion as there was an even mix. For the East Pacific Ninas (like we will have this winter), maybe surprisingly, the opposite was true, as “West” North Pacific Ridges were more favored (11 of the last 14 cases). In addition, when restricting this to East Pacific Cool ENSO winters that yielded a “North” North Pacific Ridge, 7 of the 8 cases produced a “North” North Pacific Ridge that was biased to the “West.” iii. Finally, when looking at autumn 500mb patterns, wintertime “Northeast” North Pacific Ridges tended to feature positive height anomalies in the Eastern Gulf of Alaska and along the Canadian and U.S. west coast during months of Oct-Nov. Since noteworthy positive anomalies are lacking in this region this autumn, this factor is also leaning toward a “West” North Pacific Ridge placement. Bottom Line: Based on the combination of an East Pacific Cool ENSO event, the frontend of the QBO phase, and the current & projected 500mb pattern this autumn, I favor the development of a “North” North Pacific Ridge that is variable, but biased to the northwest in the mean winter pattern.
-
November 2017 PNW Discussion Thread
Brian_in_Leavenworth replied to stuffradio's topic in West of the Rockies
Thanks. It seemed like it was 4 inches at my apartment, and maybe it was, but I probably didn't measure it. And it was a ways away from the airport. -
November 2017 PNW Discussion Thread
Brian_in_Leavenworth replied to stuffradio's topic in West of the Rockies
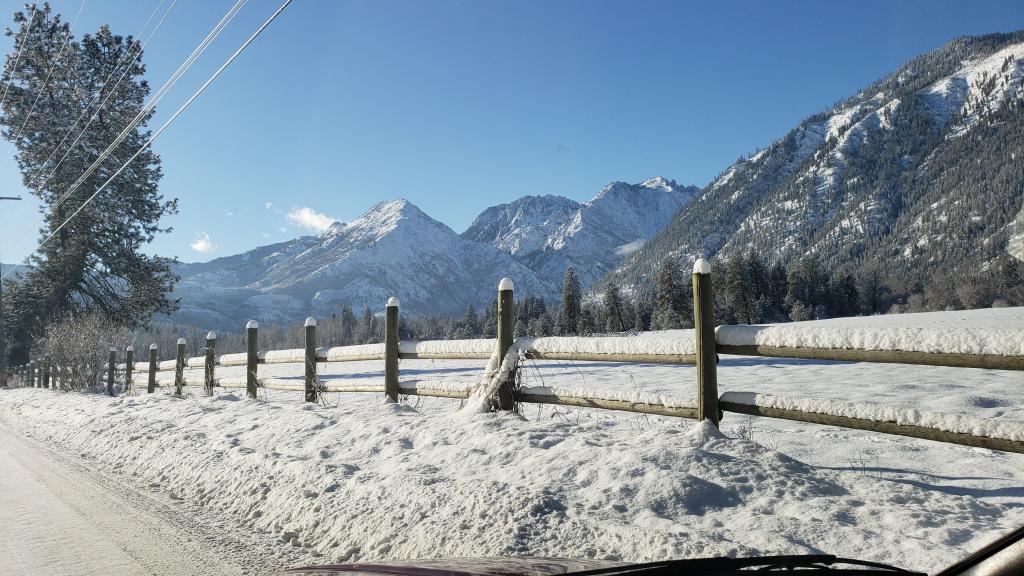
Happy for all of you in the Bellingham area, where I used to live. Great to see a real snowfall FWIW, pro met Ed Vallee, who forecasts for energy interests, posted this today.
-
November 2017 PNW Discussion Thread
Brian_in_Leavenworth replied to stuffradio's topic in West of the Rockies
What do the records show for October 28, 1991? I remember getting about 4 inches of snow in the Sehome area that day. Only snow we had all winter (el-Nino) -
November 2017 PNW Discussion Thread
Brian_in_Leavenworth replied to stuffradio's topic in West of the Rockies
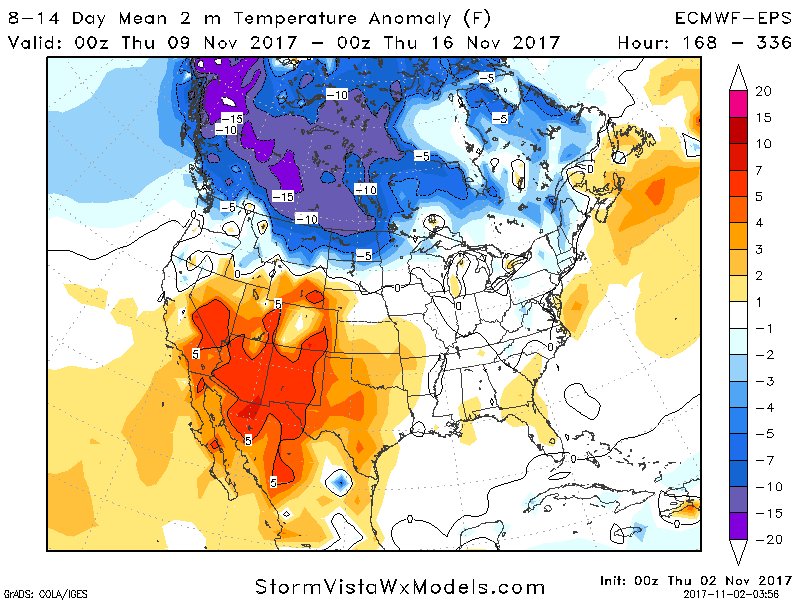
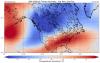
This is why I don't attempt to make forecasts, it is just too difficult, I give a lot of credit to people who do, and even if they turn out wrong, I respect that they gave it an effort. Models say one thing, then you have analogs, etc. So you won't hear me criticize anyone's forecasts. I know some of the mets are absolutely adamant that the east will have a massive ridge for the 2nd half of November, with maybe a quick shot of cold first. BTW, last nights 0Z ECMWF EPS 8-14 day outlook shows cool temps for Washington, not icebox, but cool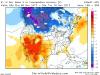
-
November 2017 PNW Discussion Thread
Brian_in_Leavenworth replied to stuffradio's topic in West of the Rockies
It's not just that model though, it is also the JMA, the POAMA, the CanSips, the Euro Weeklies and even the regular Euro for day 11-15,, and a lot of pro mets who do long range forecasting, like for energy interests are calling for this pattern. Obviously they could all be wrong, it wouldn't be the first time, but this isn't just a random one time run of a long range model showing it. -
Looks like another trade wind burst coming up.
-
November 2017 PNW Discussion Thread
Brian_in_Leavenworth replied to stuffradio's topic in West of the Rockies
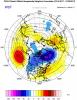
JMA forecast for November is out. Got it from tweets from @BenNollWeather 500MB heights Temp anomaly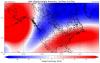
-
October 2017 PNW Discussion Thread
Brian_in_Leavenworth replied to stuffradio's topic in West of the Rockies
Posted this in the November thread, but a met named Michael Clark tweeted about the Euro Weeklies, run a day or two ago. This is for the 4 weeks of November.
-
November 2017 PNW Discussion Thread
Brian_in_Leavenworth replied to stuffradio's topic in West of the Rockies
Got this from a tweet by a met named Michael Clark, from BAMWX.com This was from the Euro weeklies run a couple of days ago for November.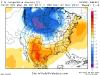
-
October 2017 PNW Discussion Thread
Brian_in_Leavenworth replied to stuffradio's topic in West of the Rockies
I know models can be that precise, but there is a contradiction with the ECMWF, where the map showing sensible weather in 3 hour increments shows all rain for not only Bellingham, but all areas to the South, including the Chuckanuts (I know the area, I used to live in B'Ham for almost 30 years), but the cumulitive snow map shows a lot of snow. My guess was that the snowfall map was not as precise as their sensible weather map. It works well if it is indeed an all snow event, but not so well in marginal situations. Why they show a difference is what I am wondering. Since the cumulitive maps arent actually weather maps, just adding up things, maybe they have a lot lower "resolution". -
October 2017 PNW Discussion Thread
Brian_in_Leavenworth replied to stuffradio's topic in West of the Rockies
I am having the same issue with Leavenworth, snowfall maps showing a lot, but the actual weather only shows snow for a short time, otherwise rain or mixed rain and snow. Travel 15 miles toward Lake Wenatchee/Coles Corner, they might get a lot of snow, but the snowfall maps are probably not that precise, or at least not as precise as the rest of the maps that that the Euro has. You can also go to the weather.us and see the snowfall line and freezing levels too for those time frames. For the Bellingham area, it looks like about a 500 foot snow level, if taken literally, which would mean snow in the hills, but not in the city. But I wonder if the models take into account the moderating affect of the Puget Sound, time of year (longer days than December/January), higher sun angles, etc., where the NWS does take those into account and adjusts the forecasts accordingly. -
October 2017 PNW Discussion Thread
Brian_in_Leavenworth replied to stuffradio's topic in West of the Rockies
On the weather.us site, when you go to the Euro run and focus on Bellingham, you can look frame by frame at the "significant weather" during that time frame, and all it shows is rain, though one frame shows mixed rain and snow. Yet, when you look at total snowfall, it shows a lot of "total snow" Obviously something wrong there. Probably the snowfall maps have a much lower resolution than the actual weather maps. -
October 2017 PNW Discussion Thread
Brian_in_Leavenworth replied to stuffradio's topic in West of the Rockies
I agree, they are adding maps all the time. I do wish their graphics were a bit better, but that is a minor complaint. I like that you can zoom into your location (does Weatherbell do that?). And best of all it is free -
October 2017 PNW Discussion Thread
Brian_in_Leavenworth replied to stuffradio's topic in West of the Rockies
Have you tried weather.us ? Especially for the Euro. Even has Euro ensemble charts for 15 days for any location I PM'd you about it. Dr. Ryan Maue, who used to work at Weatherbell, started weather.us -
October 2017 PNW Discussion Thread
Brian_in_Leavenworth replied to stuffradio's topic in West of the Rockies
I asked weather.us on facebook about whether or not there will be incremental snowfall maps for the Euro, as right now they only have total accumulated snowfall maps They quickly replied and said "Yes, much more is coming as soon as our COO Ryan Maeu works with our team to develop more products in the coming weeks/months!" I remember a few years ago there was talk about how much it would cost to get a ECMWF subscription for the forum (A lot), but now we won't have to. Gone are the days where we only had a few basic Euro maps at only 24 hour increments.