-
Who's Online 15 Members, 1 Anonymous, 280 Guests (See full list)
-
Activity Stream
-
2262
April 2026 Weather In The PNW
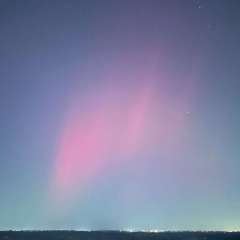
You’re misinterpreting what I said, and also incorrectly applying linear analysis to a nonlinear/state dependent system. 1) The global surface temperature record is trash pre-satellite era. This is evidenced by the fact sea levels have been rising at a relatively steady rate since the end of the LIA, which requires substantial thermal input given the degree of latent heat absorption involved in melting ice (and especially since the majority of SLR is in fact steric). It’s physically impossible to have that degree of SLR absent systemic warming in a well mixed system (see bottom image). 2) The enhanced state baseline/-ENSO tendency has been ongoing since at least the mid-1800s, the ENSO graphic you posted tells us absolutely nothing. The shift in tendency isn’t substantial either, we’re talking modest changes in amplitude and frequency of events. Depending on how you plot it, visually it won’t necessarily stand out like a sore thumb.- 1
-

-
2262
April 2026 Weather In The PNW
I’ll be surprised. We haven’t had a major wind event in all the years I’ve lived in this area. We HAVE lost a huge amount of our canopy and were a day or so from having to evacuate the eastern metro area due to destructive heat and fires.- 1
-

-
2262
April 2026 Weather In The PNW
Slim chance to avoid the 80 burger this weekend. Thoughts and prayers during this tough time- 1
-

-
2262
April 2026 Weather In The PNW
Also a good watering which helped excess vegetation grow in the mountains north of I-90. Will be drying up nicely in the next month, before the thunderstorms kick off and sparks fires. -
604
April 2026 Observations and Discussion
Indianapolis had its warmest April on record this year. The final week of the month was a bit cooler than anticipated, which prevented a top 5 warmest April here, though it was still phenomenally warm (and active) overall.
-