
Leaderboard


Popular Content
Showing content with the highest reputation on 03/24/17 in all areas
-
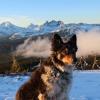
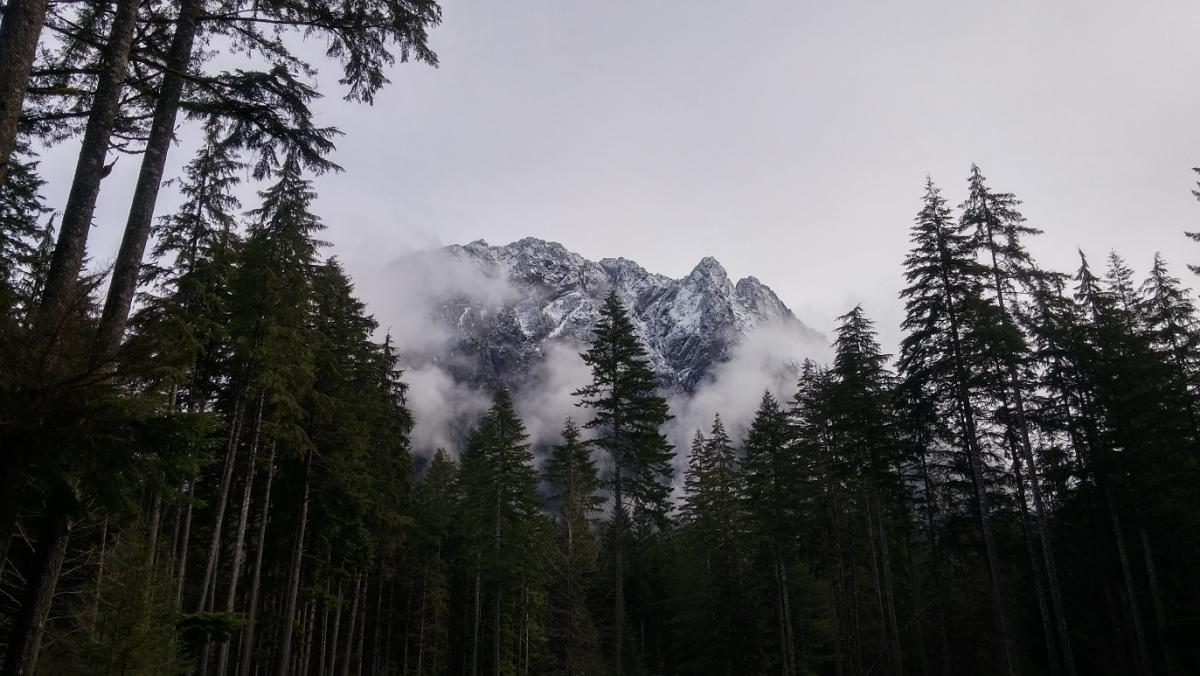
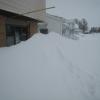
Great day yesterday. Got some shots deep up in the Middle Fork Snoqualmie Valley where winter still hangs on.
 3 points
 -
Bachelor picked up 10" since last night. Just what the doctor ordered. Even Santiam was snow covered earlier.2 points
-
Haha, well in that case I think Montana is probably too snowy for you. It's also cold as a mofo up there during winter with the dry air and radiative cooling at night. If you want less than a foot of snow per year, I think you'll probably have to move south. A good proxy for convective vigor is lightning activity. Here's a high resolution, satellite-derived lightning map averaged from 2005-2014, first sorted by flash density, second sorted by stroke density . Gives a pretty good idea of where to expect the best convection: http://www.vaisala.com/VaisalaImages/Lightning/avg_fd_2005-2014_CONUS_2km_grid-800px.png Here is stroke density, as opposed to flash density. http://www.vaisala.com/VaisalaImages/Lightning/avg_sd_2005-2014_CONUS_2km_grid.png2 points
-
Pretty happy with my forecast today, though a broken clock is right two times a day... Anyway, I just so happened to be at my parents house when we heard a crack of thunder. The clouds were definitely rotating, as showed on radar. However, after the hail etc passed, thought it was done. Told them the threat for a tornado for us was over. Turns out it his just SE of our location. On the map, their house is on the very bottom left. Obviously a very weak tornado, but a pretty decently long path as it skipped along, downing a couple trees, but mainly doing fence/gazebo damage. I saw no structure damage to houses, not even missing shingles.1 point
-
From what I can tell, this is only the 3rd time that Chicago has had an 80+ degree temperature and a 6"+ snowstorm 10 days or less apart, and the first time it's happened in March. The 1910 case appears to have been a slow moving cutoff low, so it's included even though it spanned 5 days. 4/22-26/1910: 6.4"; high of 86 on 4/29 10/18-20/1989: 6.3"; high of 83 on 10/15 3/12-14/2017: 7.7"; high of 82 on 3/241 point
-
ORD reached 82. Broke the record for the day!1 point
-
Just finished up some 20 yard sprints at the park (while doing a 16 hour fasting)...it feels like summer out there! Currently at 75F...lovin' every minute of it...that is, until the pneumonia front hits after 6:00pm...doh!1 point
-
Pretty incredible proof of the LRC rearing it's ugly head this year. You can see proof of the big ridge that has affected us in the Central US. Gary wrote about this in his morning blog. If we don't see rain in the next couple of weeks the drought will only continue to expand.
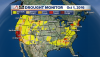
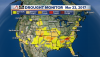 1 point
 -
ECMWF ensemble outlook for April...this looks nice...1 point
-
So, when looking at things via this perspective, it explains why the upper troposphere is cooling slightly, and also it explains why specific humidity is declining above 400mb, yet increasing in the lower troposphere. Both of these observations directly contradict climate model forecasts, which suggests that we're misdiagnosising at least a portion of the observed warming that has occurred in recent decades. Temperatures @ 200mb, required to warm under GHG induced warming scenarios but are actually cooling on all operational datasets: http://i724.photobucket.com/albums/ww243/phillywillie/Mobile%20Uploads/FA2B5BB8-D569-46C3-B6CA-29FCF996C140_zpstaurignz.gif Humidity by altitude/pressure level, also homogenous on all operational datasets: http://i724.photobucket.com/albums/ww243/phillywillie/Mobile%20Uploads/F3D8F3DB-5B93-4EA8-A37D-8708685AC21F_zpsyepxrahh.gif1 point
-
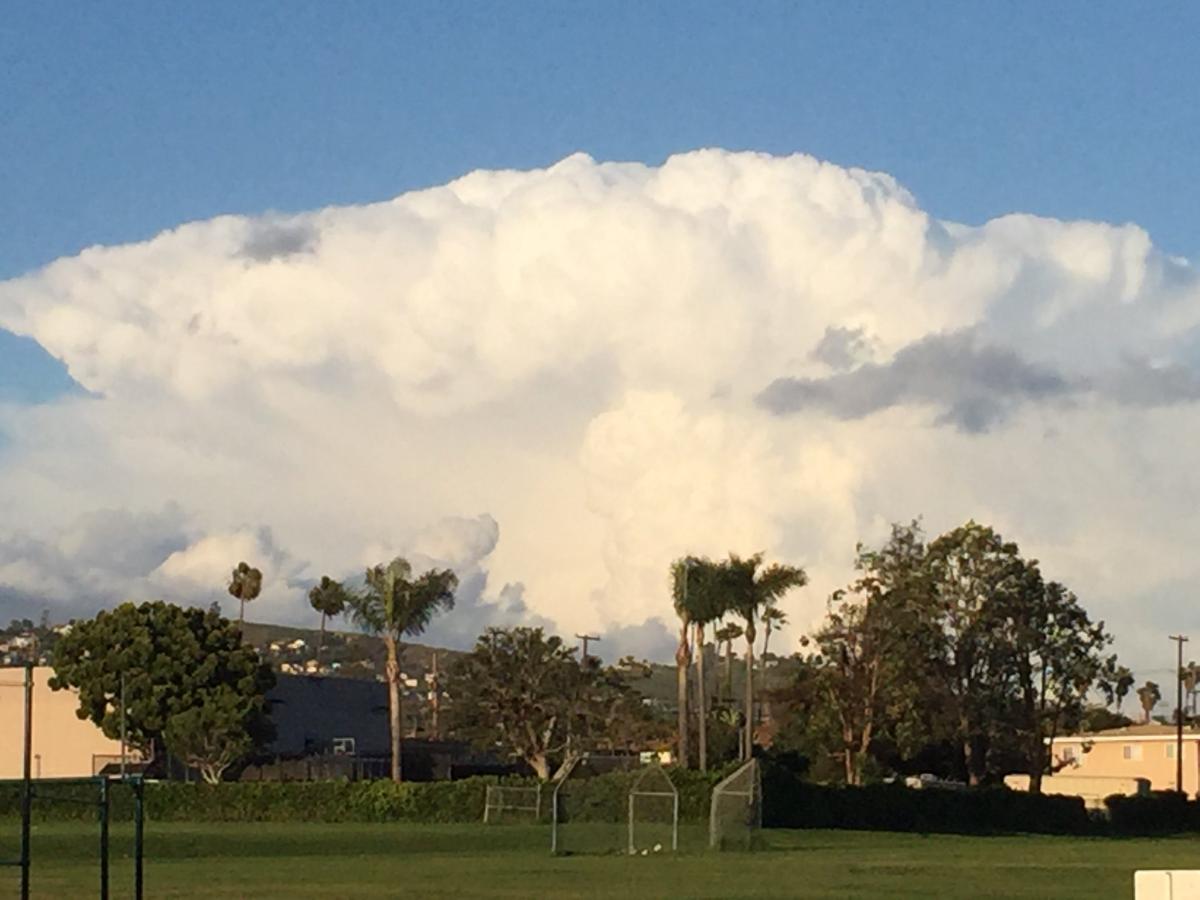
Earlier photo of the cell that is producing flash flooding
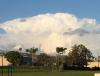 1 point


This leaderboard is set to Vancouver/GMT-07:00