
Leaderboard


Popular Content
Showing content with the highest reputation on 09/14/16 in all areas
-
Jinx! Mother Nature sure knows how to troll.3 points
-
High of 77° with clear skies all day. A+ day Not quite as cold as the past few morning, but still down to 45°. Sunset tonight
 2 points
 -
I just want winter, regardless of if it's front loaded or not.2 points
-
Is chest-pounding time over?2 points
-
What are some good and interesting USA weather trivia questions that aren't simply something that anyone can google? I have a few I can think of. What city in the Lower 48 has its all time record high temperature in March? Which city in the Lower 48 has a record high in all months besides July that are higher in July? Which locations in the US have reached both over 100F and -60F or below (I live next to one)? One of my favorite: Without cheating, match the record highs in each month to the month they belong to. This is for the LAX station: January February March April May June July August October November December 110 106 104 102 101 98 97 97 95 94 92 91 Which monthly record high temperature goes to which month? ================================================================== What are some more good ones?1 point
-
Definitely before, unless you work best under pressure.1 point
-
Pretty interesting to note we will be finding ourselves in yet another situation that would be quite cold in the winter early next week. Certainly a theme lately.1 point
-
Looking pretty cool overall for the next couple of weeks.1 point
-
Might have to rename this the baseball thread if they keep winning...1 point
-
For the record I am thinking a weak NINA is now very possible...Some of the more recent CFS runs show ENSO rebounding to neutral in April before beginning to drop again...Maybe we can avoid another Nino1 point
-
Today was gorgeous. Early fall perfection.1 point
-
Absolutely crazy trade wind burst / high SOI going on right now. No question ENSO SST's will drop considerably. I'm mystified why some mets had already given up on the Nina. The trust some of them have in the models is breeding an atmosphere of lazy meteorology.1 point
-
I thought Andrew was our designated CFS surrogate. Seems like we didn't need a second.1 point
-
Fantastic weather here the last day! I've picked up .66" in the last two days with numerous thunderstorms. I even had one at 5 am this morning with dime sized hail, wind, and a lot of lightning. 18z GFS shows it cold enough for marginal snow in 8 days, but I have my doubts, as I should at this point.1 point
-
This is one of my biggest complaints. It is so absurdly simplistic and does not represent what we know as a field.1 point
-
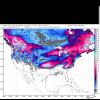
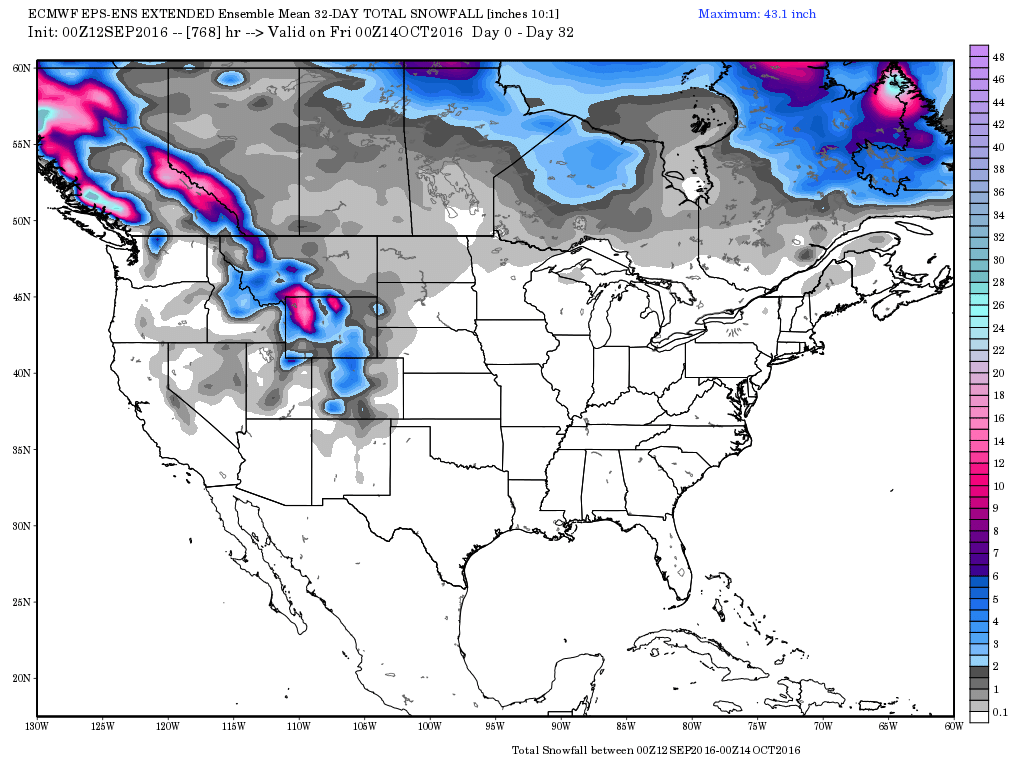
Looks pretty good from what I can tell. This is the 32 day. I've noticed that the CFS and euro have been pretty similar for awhile.
 1 point
 -
1 point
-
Euro ensemble and operational are in great agreement through days 7-8. After that, there is clearly a lot of disagreement among individual members in the long range. Might just have to sweat this one out.1 point
-
It's Fraser if you want to use official data. At the old Fraser station, there was an average of 317 days. The station was moved to a slightly in 1988 to a slightly warmer location. Since 1988, the average has been 293 days. Stanley Idaho has 291 days. Not that far away Obsidian Idaho reported an average of 294 days, but the weather station doesn't exist anymore. The reason I said "official data" above is because it is known that Tabernash, just down valley from Fraser is colder at night. Fraser though, has the official weather station. Also Bowdie California has an average of 302 freezing days, but it's more of a ghost town than a town now days. Crow Agency, Montana. Great question. I know of several cities and towns that have their record low in March, but I don't know which one would have it on March 14. Outside Hawaii, I do know one that has it's record low on April 2 and another on March 21, but I don't know which one would be for March 14. Here are some places I know of in the lower 48 that do have their record lows in March, or did until not that long ago: Iowa (several locations) due to the March 1962 cold snap. Southeast USA (March 1980 cold snap, though most of these were eclipsed in 1985) Those were in early March though. In the mountains, White Mountain 2 California has its record low on March 10 and Allenspark Colorado on March 12. Along the coast of California from the San Francisco Bay to southern Oregon there are several places that have experienced temperatures in March and April that are about as cold as those in the winter months. My guess is that the March 14 date is somewhere along that coast? If not in the Rockies, I would assume that it would have to be somewhere in upstate New York? Maybe, but there is a chance that it is legitimate. There were few weather stations in the Rocky Mountain region during that cold snap (January 1888), but some of the ones that did exist reported some incredible temperatures. In addition to the Fork Keogh reading, during the same cold snap, Randolf Utah also recorded a -65F reading, far colder than any modern reading at either location. It is said that the native Americans in Montana said that it was far colder than they had ever experienced living there. I don't know the accuracy of the readings, and both the Randolf and Fort Keogh readings seem incredible, but since more than one location reported temperatures far colder than the modern readings at either location, it might be possible. The January 1888 cold snap seems to be by far the worst severe to hit the Rocky Mountain region in historical times, but there were few weather stations there to record it. The few that existed reported some incredible temperatures. Too bad that there was no weather station at Peter Sinks then. If nearby Randolf really did reach -65F, Peters Sink must have been off the charts!1 point
-
A correction is warranted here. I got tripped up between the two POR's at Great Falls. Yesterday's 27 actually broke the 29 from 1970 at GTF airport. But since the NWS threads GTF records with the older city data, officially yesterday's reading only tied the previous record of 27 from 1921.1 point
-
It's been nice knowing you guys, but apparently I'm going to drown on Saturday.
 1 point
 -
"Although the Amazon region is located geographically close to the equator, the southern part suffers, where appropriate, the action of frontal systems, causing the phenomenon locally known as Friagem (Big Chill). The effect of these polar air raids in the Amazon has been little studied and only the studies of Brinkman and Ribeiro (1972), Hamilton and Tarifa (1978) Fisch (1996) and Marengo et al. (1996) detailed these effects. Fisch (1996) conducted a simple statistical number of Big Chill events in South Pará during the years 1992 and 1993 and obtained a frequency of occurrence of 7 cases per year during the months of May to August. Brinkman and Ribeiro (1972) report that in the case of Central Amazon, occur 2-3 chills per year, during the dry months (June to October). Analyzing the event of a hit region that Chill Manaus (July 1969), Brinkmann and Ribeiro (1972) showed that the event was at the minimum temperature 12 C lower than the climatological average, resulting in strong winds. In the case of variations of climatic elements, Hamilton and Tarifa (1978) analyzed the penetration of an intense cold front (which occurred in 1972), which caused decreases in air temperature in Cuiabá (MT) of up to 13 C. Other important observations are that there is a wind direction change (from north to south), the cloud cover is total and that the event extends to 700 hPa (approximately 3000 m), extending for 3 days. Also regarding the meteorological characteristics of the surface, Marengo et al. (1996) analyzed the spatial extent of changes caused by two mild chills occurred in 1994, noting that the most pronounced effects were obtained in Southern Rondônia (Ji-Parana), in which the air temperature reaches 10 C values, about 8 C below the climatological average. In the central and western regions of the Amazon (Manaus - AM and Maraba - PA, respectively), the decrease of the air temperature was not so great, although the amount of atmospheric moisture has also decreased, inducing that occurred polar air raid (cold and dry). The changes in the vertical structure of the atmosphere were studied by Fisch (1996a), who observed a strong increase of wind speed (mainly in the meridional component), associated with a strong cooling (around 15 C in the atmospheric boundary layer). This information was collected in July 1993, during the course of RBLE the field experiment." Translated from: http://climanalise.cptec.inpe.br/~rclimanl/boletim/cliesp10a/fish.html1 point
-
Yeah that would be my guess * At least 4 months >= 10c * Precipitation >= 800 mm * Annual temp >= 3c * Annual temp amplitude >= 20c I added a subtype "temperate boreal" for low elevation locations with coldest month <= -5c which can be used to categorize continental climates in the northern tier of the US and southern Canada (where they also meet temperate requirements). Yeah I look at the climate of the year as a whole so the hallmark of temperate is having fairly high variations in temp through the year (high degree of seasonality) without a very lengthy warm season (subtropical) or very lengthy cold season (subpolar).1 point
-
So, I guess my climate is humid temperate continental under this system? I like that much better than the humid subtropical crap, haha. I'd argue that our summers are purely tropical/humid tropical, while our winters are humid-continental, if such a description were viable. Cold fronts/continental airmasses rarely (if ever) make it here during July/August, just endless S/SW flow around the Bernuda High, usually. Winter is usually dominated cold, dry W/NW flow out of Canada as the Bermuda High retracts towards the Azores, hence is referred to as the "Azores high" during winter/spring.1 point
-
@ Jaster, your wish of warm Autumn weather is in store for much of next week. Maybe a few days in a row in the 80's??? Must say, 80's this time of year are much more enjoyable with lessor dew points. I can tolerate mid 60's, but the 70 degree or higher dew point gets pretty annoying quickly.1 point
-
GFS showing a couple big wound up systems affecting the upper midwest in mid-long range with cool air pushing behind em. Might be correlating with the East Asian Theory.1 point
-
The 85 at Eureka on 2/17/1930 is a legit reading as far as I'm concerned. Major downslope heating event. Scotia was 82 that day which is in the same general area as Eureka. That reading stood as the all-time record high at Eureka (along with 85 on 6/6/1903, 9/21/1939, 6/17/1945, 9/6/1958, and 9/12/1979) until being broken with an 86 degree reading on 9/20/1983 and again with an 87 degree reading on 10/26/1993. They can see all-time record level heat almost year round. FYI Eureka set a new July record high on 7/28/2015 with 77 degrees.1 point
-
Will be interesting to watch what happens once the tropical forcing shifts over the Pacific. I'd have to think ridging will begin to take over once again sometime during the last week of the month. Looking at the cooler SST's (unfavorable regime for propagating wave activity) the MJO looks to have free roam from the Eastern IO to the Central Pacific (dateline). The West Pac-Central Pac will be the wild card in my opinion.1 point
-
NOAA's State Climate Extremes Committee (SCEC) actually took care of this one a few years ago. http://www.ncdc.noaa.gov/extremes/scec/records A 118°F temperature that had persisted in the record books at Bennett, CO on July 11, 1888 was found to be a typographical transcription error. Area temperatures were at least 15-20 degrees cooler that date (the highest being a 105°F observation at Glenwood Springs). The state record is now listed as 114 at Las Animas (7/1/1933) and Sedgwick (7/11/1954). I'm not sure why the 114 at Las Animas on 6/24/2012 didn't make it onto that list. That reading was widely reported at the time and shows up @ the WRCC. https://www.wunderground.com/blog/JeffMasters/comment.html?entrynum=21331 point
-
The ECMWF is really chilly for next week. Another high amp block well off the coast.1 point
-
Then there's the 119 at Prineville in July 1898. Which is even more absurd. I remember reading that the 119 @ Pendleton was actually extrapolated from a thermo that only read to 113/114 degrees. There's no way something like that would be accepted as official today. Very likely overexposed as well, since the next highest reading in the PNW from that heat wave was 115 at Kennewick. Which is at a lower elevation than Pendleton.1 point
-
FWIW, said this before the models did their about-face. If anything I was too slow.1 point
-
Well, that was a shift...from 95 degrees @ PDX to...hoth?1 point
-
Can't believe I've never seen this! Thanks for the link. Amazing times1 point
-
It seems like a lot of mets and stations simplify their winter forecasts down to a single variable. How disrespectful to the world... Seriously... a bachelors or better in atmospheric science and you're going to tell me the sst's in the NE pacific are bases for a winter forecast? GTFO1 point
-
Yes, and it is legit. The city is Brownsville Texas (106F on March 27 1984). In that part of Texas, late winter and early spring heat waves are surprisingly common. The hottest temperatures in much of Mexico are often recorded in the Spring and occasionally the hot air makes it as far north as Texas. There are actually quite a few cities or locations in Texas where the record highs in March (and even February) aren't that far from those in summer. In Corpus Christi for example, the record high in March is 102F, while the record high in July is 103F, at least at the airport. In San Antonio, the record high (at least at the airport) is 100F for both February and March. The record high in July is 106. In Armstrong, the record high is 101F for March and 105F for July. There are actually quite a few places with similar stats in Texas. Outside Texas, before 1983 Eureka California used to have it's record high in February (85F in 1930). Since the temperature has reached 80F on other occasions in February and since freak warm spells have happened in the other usually cooler months, it is possible and the record may be legit. Also interesting is that July in Eureka has a record high of 76F. All other months have recorded warmer temperatures than this, including all of the winter months. July has the coldest record high of all the months of the year. On the East Coast, Block Island, Rhode Island used to have its record high in April (it was broken in July a few years ago). The April record is also probably legit as other stations in Rhode Island recorded very warm temperatures in April 1976. In Providence, for example, the record high in April from the same heat wave is still warmer than any temperature recorded in May or June. Even the state record for Rhode Island is higher in April than in May. Also in the Eastern States, Caribou Maine has its record high in May. This seems to be legit as well. (A few places in Florida also have their record highs in May). On the other end of the calendar, several cities in California and even a few in Oregon have their record highs in October.1 point
-
Must be a sign of the winter to come, Oklahoma and Ohio State have only played football against each other twice prior to Saturday. September 1983 and September 1977. Haha. :-)1 point
-
I like the conclusion about '09-'10. Lol. That one had me laughing pretty hard. It's like "Wtf? I dunno man, but it sure snowed a lot." Lol. Same in 2010-11. There isn't really anything that you can say made that happen but I sure liked it.1 point
-
Jaster, what's even better is that NONE of those bad years are in my analogs! Everybody has posted some really good stuff today. I really don't have much to add but I like it!1 point
-
Kinda like this 7-day forecast??? I hear ya loud and clear. September will probably end up above normal around the Lakes region, unless it really cools off towards the end of the month. So far its running 2-4F above normal. I can't say that I don't like Autumn days as you have explained. Autumn 2007 was a perfect example of Indian Summer weather all the way into November, then the pattern flipped hard and Winter took control. At this point, I'm fine if it turns cool/wet as October rolls on in. We have had a very long streak of above normal temps since the summer of last year. Tbh, I wouldn't mind a pattern change, although, if you have any outdoor projects, that would put a damper on it.1 point
-
Interestingly it's humid subtropical under the Koppen classification as well (the northern extent being roughly NYC on the east coast). Living there for a summer I bet you understand why, haha. Edit: actually the January mean temp is 0.5c in Philly so the proper classification would be temperate (D) rather than subtropical. I'm guessing temperate continental humid Dc(h) as precip is fairly evenly distributed and > 800 mm annually. I got pretty much the expected results for Portland...the climate is very borderline between temperate semi-continental (a continental/maritime hybrid classification) and temperate maritime...the only issue being that there's a very distinct dry summer regime here even at the coast, so it isn't strictly maritime/oceanic really anywhere in Oregon from a precip standpoint. My fear was that Portland could potentially end up with a "Mediterranean" classification which is IMO a subtropical subtype...though Koppen-Geiger includes decidedly temperate locations under the Mediterranean type because precip is the determining factor in their definition, while I hold that temperate dry summer climates are separate from classic Mediterranean.1 point
-
From what I've read, its never happened. The topography doesn't support it. There have been some close calls though, i.e. the Superstorm of March 1993 produced a wind shift and dewpoint drops on the Caribbean coast of Colombia in its wake, but this is still around 10 degrees N. The South American topography is unique in that it offers a meridional "funnel" for dense, cold air traveling northward the entire length of the continent. This funnel being the interface of the Andes Mountains and the flat plains to the east. Its similar to how cold airmasses are able to slide down the lee side of the Rockies in North America. In South America the Andes offer cold Antarctic airmasses an unbroken "path of least resistance" from 50S all the way to the equator, and then a bit further north. This is what allows for cross-equatorial penetration, but even then it happens only with the strongest troughs. The biggest one on record was July 1975. A record high pressure system (1044mb in Brazil) pushed a low level cold front all the way into northern Venezuela. It actually capped tropical convection in the region for a week, something that would otherwise never happen. http://journals.ametsoc.org/doi/pdf/10.1175/1520-0477(1976)057%3C1435:ASHCFP%3E2.0.CO%3B2 Good write-up on the 1975 event.1 point


This leaderboard is set to Vancouver/GMT-07:00