
June 2017 Observations and Model Discussion for the Pacific Northwest

-
Who's Online 8 Members, 1 Anonymous, 35 Guests (See full list)
-
Popular Contributors
-
1

-
2

-
3

-
4

-
5
-
-
Activity Stream
-
3579
May 2024 Pacific Northwest Weather
People die during major arctic blasts as well…Unfortunately it happens at both extremes all around the world. -
10
Downtown LA - Will May 2024 end up even colder than May 2023?
May 26 high: 70 F 2024 average high for Downtown LA as of May 26: 70.23 F Average high for remainder of May 2024 required to tie last May: 67.40 F Average high for remainder of May 2024 required to average 70 F for the high: 68.80 F -
353
-
353
May 2024 Observations and Discussion
8:28 pm, just prior to the storm, at the Prairie Home Cemetery just east of Holdrege Nebraska. -
353
May 2024 Observations and Discussion
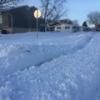
Another day, another storm. Looks like close to 0.50” in 15 minutes this evening. IMG_2129.mov
-

Recommended Posts
Join the conversation
You can post now and register later. If you have an account, sign in now to post with your account.