

-
Who's Online 13 Members, 3 Anonymous, 75 Guests (See full list)
-
Popular Contributors
-
1

-
2
-
3

-
4
-
5

-
-
Activity Stream
-
3008
April 2024 Weather in the PNW
Gonna be a squeaker, but looks like SLE may finish April below normal. -
155
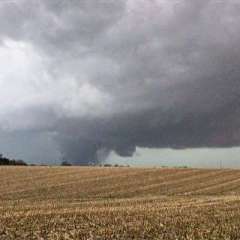
April 24-29 Multi Day Central and Southern Plains Severe Weather Outbreak
Maybe this isn't the right thread to post this, but I like how the SPC has upped our storm chances this evening, but the HRRR and several other models want to split the storms north and especially south of eastern Iowa. Hopefully those models are wrong. The warm front has passed through here, but maybe there's a moisture gradient the storms might follow further south. I haven't taken time to read the NWS AFD yet. I see storms are beginning to pop in eastern Nebraska and they could easily dive se. eventually. -
155
April 24-29 Multi Day Central and Southern Plains Severe Weather Outbreak
Yeah I was checking the monthly COCORAHS reports yesterday and noticed the Bloomfield area had even higher April rainfall totals, like up to 9"+! My sister in south central KS says they're drying up and I noticed they again missed the recent rains. They're not farmers, but already the other week she said the wheat may be toast er long. I'm glad to hear that the COCORAHS gauge is nearly identical to the official one because I have two of those and like them. I'm guessing the COOP gauge is more accurate beings it has a larger diameter. I actually have 5 gauges out. Two other small ones always show less unless it rains a lot, like over 1" as they tend to catch up. I like my digital Davis gauge, but it's not consistent and I never fully trust digital gauges. I have a spare older Davis station/gauge and both rain guages had to be adjusted up a bit (calibrated) to match my other gauges. The new Vantage Pro2 has a redesigned gauge so the wind affects the rain less that's entering it. I don't know if the new design helps much. Davis finally came out with a touch screen console last year but it needs to be plugged in an outlet as battery backup won't last long. I'd get one if they'd make it totally wireless like what I have. -
3008
April 2024 Weather in the PNW
Forecast looking good for Everett. Love seeing that rain.- 1
-

-
3008
April 2024 Weather in the PNW
Having trouble cracking 50 by noon here again. Brrrrrr.- 1
-

-


Recommended Posts
Join the conversation
You can post now and register later. If you have an account, sign in now to post with your account.