
-
Popular Contributors
-
1

-
2
-
3

-
4

-
5

-
-
Activity Stream
-
95
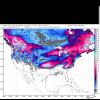
April 24-29 Multi Day Central and Southern Plains Severe Weather Outbreak
Ended up being too far north for the severe weather, mainly just had a couple rumbles of thunder. We did receive some beneficial rainfall though with 1.12 in the bucket. We are now above average for total April precip. If I knew the tornado outbreak was going to be as prolific as it was down near Omaha yesterday I would have tried to make my way down there and check it out. Ever since I watched Twister as a kid, I've always wanted to see a tornado in person. Maybe one day.- 1
-

-
224
April 2024 Observations and Discussion
Yesterday I woke up to a temp in the 40s with a dewpoint in the low 30s. Today it is in the 60s with a dewpoint in the low 60s.- 2
-
-
224
April 2024 Observations and Discussion
It's a very nice and cool 57F here today with partly cloud skies. It has been quite breezy the past few days and today will be another repeat performance. I'm certainly enjoying the BN temps after reaching the 100's earlier in the week. Low 80's are kinda cool to the skin when you leave the pool, esp in the wind and dryness of the air.- 1
-
-
95
April 24-29 Multi Day Central and Southern Plains Severe Weather Outbreak
Up to 100 preliminary #tornado reports for the tornado outbreak yesterday in Nebraska, Iowa, Kansas, Missouri and Texas with another high-end tornado outbreak possible today over the southern Plains- 1
-
-
95
April 24-29 Multi Day Central and Southern Plains Severe Weather Outbreak
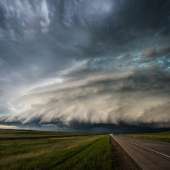
That sounds wonderful and I think you will have full ponds after this event...you've missed out on the previous storm chance but now it appears the tables have turned. Not just you, but a lot of peeps on here have scored. @Grizzcoat, you really did a good job capturing those TOR's and I'm sure this will be a vivid memory that will be remembered for the rest of your life. I'd love to go storm chasing one day and be able to hear the sights and sounds of a EF 3 or higher. Just and incredible thing to be able to witness. Those wedge TOR's were just picturesque Beasts across NE into IA!- 1
-
-


Recommended Posts
Join the conversation
You can post now and register later. If you have an account, sign in now to post with your account.