Jump to content

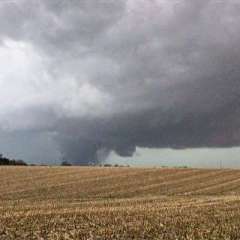
August 2016 Observations and Model Discussion for the Pacific Northwest


Geos

Recommended Posts

0z GFS is certainly trending away from any major warmth after the brief run later this week.

  • Like 1

Death To Warm Anomalies!


Winter 2023-24 stats


Total Snowfall = 1.0"

Day with 1" or more snow depth = 1

Total Hail = 0.0

Total Ice = 0.2

Coldest Low = 13

Lows 32 or below = 45

Highs 32 or below = 3

Lows 20 or below = 3

Highs 40 or below = 9


Link to comment
Share on other sites

Still an incredible lack of action over the Atlantic. Really strange considering the conditions appear to become increasingly perfect for something big to happen.

Death To Warm Anomalies!


Winter 2023-24 stats


Total Snowfall = 1.0"

Day with 1" or more snow depth = 1

Total Hail = 0.0

Total Ice = 0.2

Coldest Low = 13

Lows 32 or below = 45

Highs 32 or below = 3

Lows 20 or below = 3

Highs 40 or below = 9


Link to comment
Share on other sites

Also a few degrees cooler for Friday and Saturday, more in line with the Euro. A last minute overachievement may yield 96 or 97 at PDX, but 100+ looking extremely unlikely.

PDX not hitting 100 would almost be a story in itself for this summer.

Death To Warm Anomalies!


Winter 2023-24 stats


Total Snowfall = 1.0"

Day with 1" or more snow depth = 1

Total Hail = 0.0

Total Ice = 0.2

Coldest Low = 13

Lows 32 or below = 45

Highs 32 or below = 3

Lows 20 or below = 3

Highs 40 or below = 9


Link to comment
Share on other sites

I am just happy to see a relatively pleasant pattern through the entire run as opposed to the deep troughing that some runs showed recently.


Was not even thinking about extreme heat.  

**REPORTED CONDITIONS AND ANOMALIES ARE NOT MEANT TO IMPLY ANYTHING ON A REGIONAL LEVEL UNLESS SPECIFICALLY STATED**

Link to comment
Share on other sites

A wrinkle as much as localized anomalies in July! Actually less so, since the ULL made everyone cool.


And it actually isn't that surprising, given the overall pattern. When you get high pressure offshore, these sort of things tend to develop.

This 100%.

Link to comment
Share on other sites

Wow! They are bored stiff on the Eastern Weather forums right now (American). No discussion of the tropical Atlantic in over a day. The tropical storm guys must feel like I do during so many winters here. To me it is fascinating how perfect conditions have to be for tropical storms to develop. They are almost wimpy in that way. There is some correlation between high tropical storm number over the Atlantic basin and colder winters here, so I'm a bit impatient myself. Only a loose correlation, but it is there. Right now the total ACE for the Atlantic is pathetic this year.

Death To Warm Anomalies!


Winter 2023-24 stats


Total Snowfall = 1.0"

Day with 1" or more snow depth = 1

Total Hail = 0.0

Total Ice = 0.2

Coldest Low = 13

Lows 32 or below = 45

Highs 32 or below = 3

Lows 20 or below = 3

Highs 40 or below = 9


Link to comment
Share on other sites

The every 10 minutes type stuff was quite simply way too much pressure to handle IMO.


I broke out in hives several times the past few months while sweating out potential evening highs.

:lol:


It was sort of information overload, especially considering a lot of the readings tended to be bogus.

Link to comment
Share on other sites

Lots of Saharan dust.

I say we need to pave over the Sahara and bulldoze the Olympics and or Cascades while we're at it. Something always messing things up!

Death To Warm Anomalies!


Winter 2023-24 stats


Total Snowfall = 1.0"

Day with 1" or more snow depth = 1

Total Hail = 0.0

Total Ice = 0.2

Coldest Low = 13

Lows 32 or below = 45

Highs 32 or below = 3

Lows 20 or below = 3

Highs 40 or below = 9


Link to comment
Share on other sites

:lol:


It was sort of information overload, especially considering a lot of the readings tended to be bogus.

I think the bogus readings is why they changed back to hourly.

Death To Warm Anomalies!


Winter 2023-24 stats


Total Snowfall = 1.0"

Day with 1" or more snow depth = 1

Total Hail = 0.0

Total Ice = 0.2

Coldest Low = 13

Lows 32 or below = 45

Highs 32 or below = 3

Lows 20 or below = 3

Highs 40 or below = 9


Link to comment
Share on other sites

00z GFS and its ensembles weren't terrible at all.


I'm starting to think this mid-month warm period could set us up for more troughing the last 1/3 of August. Or at least another relatively cool pattern.

The Euro has been hinting at a strong GOA ridge again later in the month. That feature would give us a great winter if it becomes a "permanent" fixture.

  • Like 1

Death To Warm Anomalies!


Winter 2023-24 stats


Total Snowfall = 1.0"

Day with 1" or more snow depth = 1

Total Hail = 0.0

Total Ice = 0.2

Coldest Low = 13

Lows 32 or below = 45

Highs 32 or below = 3

Lows 20 or below = 3

Highs 40 or below = 9


Link to comment
Share on other sites

Huge differences in the IO forcing between the GFS/GEFS and ECMWF/EPS in the 6-10 day range. Like, it's not even close, one is going to bust prolifically.


Ironically, the EPS and GEFS are in close agreement during the 11-15 day range (anticyclonic retraction to Aleutians following PAC-grad overturn under a typical branstrator wave, GOA trough, AAM/PNA drop) but diverge significantly during the 6-10 day range.

Link to comment
Share on other sites

Looks like a warm week! :) -- The wedding last Sunday was quite wet but still beautiful. Only moderate rain during the ceremony. We had 193 people in attendance and they even sat through the rainy ceremony which was amazing and special... Thankfully all the post festivities were covered and dry! Here is a picture of the ceremony and me dancing with my beautiful daughter.


  • Like 7
Link to comment
Share on other sites

No doubt. After the 3 day heat wave starting tomorrow, next Tuesday looks like 95-100 here at PDX. Then still looking very warm at day 10 as the west coast ridge doesn't want to leave.


Not really. There are plenty of cool downs on the Euro, and the ridge is building offshore by the end of the run.


Do you ever notice that your really extreme heat forecasts in the long range rarely pan out?

  • Like 1
Link to comment
Share on other sites

Those ensemble clusters are subject to the same model biases as the aggregated mean and OP ECMWF. Most notably, being over slow in propagating intraseasonal forcing eastward.

Link to comment
Share on other sites

There are multiple marine layer days on the 12z ECMWF.


The ridge hype is just a bit overdone.


There are absolutely no marine layer days on the ECMWF detailed surface maps through next Wednesday (as far out as it goes). Sunny and warm every day. And it showed the last 4-5 marine layer days (Sat - Tues and part of Wednesday) perfectly last week.

**REPORTED CONDITIONS AND ANOMALIES ARE NOT MEANT TO IMPLY ANYTHING ON A REGIONAL LEVEL UNLESS SPECIFICALLY STATED**

Link to comment
Share on other sites

There are absolutely no marine layer days on the ECMWF detailed surface maps through next Wednesday (as far out as it goes). Sunny and warm every day. And it showed the last 4-5 marine layer days (Sat - Tues and part of Wednesday) perfectly last week.

I think there's something wrong with the algorithm(s) on those free wunderground maps. The modeled sounding profiles don't translate at all.

Link to comment
Share on other sites

What exactly is a marine layer day? About 95% of summer days here have some manner of marine influence.

An thermal inversion below 850mb subsequently reflected in the windfield?

Link to comment
Share on other sites

I think there's something wrong with the algorithm(s) on those free wunderground maps. The modeled sounding profiles don't translate at all.

Those maps work so amazingly well... almost every marine layer day is shown on there ahead of time. There are no true marine layer days on the 12Z ECMWF. No offshore flow either... so there is almost always some marine influence in the summer. Even on very warm days.


WRF fails to see half the marine layer days... ECMWF surface maps almost never miss.

**REPORTED CONDITIONS AND ANOMALIES ARE NOT MEANT TO IMPLY ANYTHING ON A REGIONAL LEVEL UNLESS SPECIFICALLY STATED**

Link to comment
Share on other sites

Also, that's a very high wavenumber across the NPAC on the 12z ECMWF, especially given the wave1 tropical convective signature in the 200mb CHI anomalies. I'm not buying these modeled solutions for a milisecond.

Link to comment
Share on other sites

Those maps work so amazingly well... almost every marine layer is shown on there ahead of time. There are no true marine layer days on the 12Z ECMWF. No offshore flow either... so there is almost always some marine influence in the summer. Even on very warm days.


WRF fails to see half the marine layer days... ECMWF surface maps almost never miss.

They've missed shallow inversions more than once this summer, including that sharp one in mid/late July. The modeled soundings suggested its presence.

Link to comment
Share on other sites

Join the conversation

You can post now and register later. If you have an account, sign in now to post with your account.

Guest
Unfortunately, your content contains terms that we do not allow. Please edit your content to remove the highlighted words below.
Reply to this topic...

×   Pasted as rich text.   Paste as plain text instead

  Only 75 emoji are allowed.

×   Your link has been automatically embedded.   Display as a link instead

×   Your previous content has been restored.   Clear editor

×   You cannot paste images directly. Upload or insert images from URL.

Loading...

×
×
  • Create New...