

-
Who's Online 13 Members, 0 Anonymous, 187 Guests (See full list)
-
Popular Contributors
-
1

-
2
-
3

-
4

-
5

-
-
Activity Stream
-
1676
May 2024 Pacific Northwest Weather
That being said... I am sure the 12Z ECMWF will disappoint me as usual. -
-
119
May 2024 Observations and Discussion
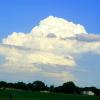
just a few of the pictures i got last night -
1676
May 2024 Pacific Northwest Weather
Saturday could be decent too... maybe upper 60s to around 70 if we are lucky. Trough position on this run is favorable for sun with northerly flow that day. -
1676
-


Recommended Posts
Join the conversation
You can post now and register later. If you have an account, sign in now to post with your account.