

-
Who's Online 11 Members, 1 Anonymous, 36 Guests (See full list)
-
Popular Contributors
-
1

-
2
-
3

-
4

-
5
-
-
Activity Stream
-
91
May 2024 Pacific Northwest Weather
Holy crap, I was gonna ask if you had any freezes while reaching the century mark but I thought that would be pushing it. I wonder how that even happens? An airmass warm enough to get to 101 ought to prevent you from reaching freezing overnight, no matter how sheltered you are. That's some Peter Sinks/Gobi Desert type stuff. -
91
May 2024 Pacific Northwest Weather
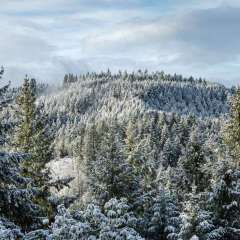
Day 1 of road trip. Perfect time of year with pleasant weather and green hills! Sahalie Falls, Celestial Falls, Deschutes River at Columbia River, Riverfront Trail in beautiful Richland, WA. Ran into some slushy snow over Santiam Pass but no issues.- 4
-

-
249
April 2024 Observations and Discussion
Every time I see this stuff I wonder how I tolerated that place for 3 years -
7525
Polite Politics
You really should watch the Tucker video I linked to on the previous page. You'd learn a lot. -
7525
-


Recommended Posts
Join the conversation
You can post now and register later. If you have an account, sign in now to post with your account.