

-
Who's Online 20 Members, 0 Anonymous, 38 Guests (See full list)
-
Popular Contributors
-
1

-
2
-
3

-
4

-
5
-
-
Activity Stream
-
79
May 2024 Pacific Northwest Weather
Currently 54F and sunny with a comfortable breeze. -
22
-
22
May 2024 Observations and Discussion
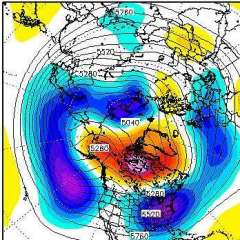
Next week could be another big event. Looking at the ensembles and other signals looks like May is going to be very active -
79
May 2024 Pacific Northwest Weather
Crazy how you can keep racking in the teens in May. All you need is a clear sky and an airmass that isn't completely torching. Have you ever had a day that reached 90F after bottoming out below freezing? -
79
May 2024 Pacific Northwest Weather
I'm expecting 1-4" of snow tonight and tommorow morning, I'm on the southern edge of the precip so this will be borderline, but cold air will not be an issue. Also expecting another couple inches of snow this weekend. 45 currently, 52/19 day.- 1
-

-


Recommended Posts
Join the conversation
You can post now and register later. If you have an account, sign in now to post with your account.