

-
Who's Online 21 Members, 0 Anonymous, 113 Guests (See full list)
-
Popular Contributors
-
1

-
2

-
3

-
4
-
5

-
-
Activity Stream
-
2173
May 2024 Pacific Northwest Weather
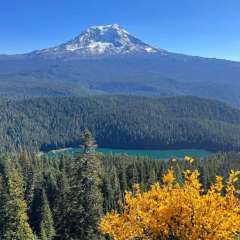
We are absolutely loving it here. Going to Capitol reef tomorrow then we’re onto Moab. Will have to check out boulder mountain here more. It’s amazing the weather that mountain creates! -
7856
Polite Politics
Sorry, no. It's not the left that's coming out with ridiculous fan pics for their leaders (there simply AREN'T any charismatic left leaders in the USA comparable to Trump, sorry). Democrats aren't wearing diapers to make a statement because of rumors that Biden is. Republicans are. Hypothetically, yes, there could be. And there have been left-wing political cults in other countries in the past. Such as around Castro in Cuba and Chávez in Venezuela. But that's all hypothetical. Practically, in the realm of what is (as opposed to as what might be) cultishness is by far a right-wing thing in the USA. Sorry. -
2173
May 2024 Pacific Northwest Weather
Bryce Canyon was one of my absolute favorites when I took a SW trip many years ago. There was afternoon lightning that time too.- 2
-

-

-
7856
Polite Politics
I get it. The left is nuts too. Doesn't make it any better. And the reality is that this is choice between two horrible candidates. I get voting for Trump. But stop this worship crap. My God. He is piece of human garbage. -
7856
-


Recommended Posts
Join the conversation
You can post now and register later. If you have an account, sign in now to post with your account.