
-
Popular Contributors
-
1

-
2
-
3

-
4

-
5

-
-
Activity Stream
-
350
May 2024 Pacific Northwest Weather
I think it’s time for our annual summer forecast contest. -
350
May 2024 Pacific Northwest Weather
GEG: Mar: +2.0 Apr: +2.1 May to date: -1.2 Warm ish spring to date- 1
-

-
350
May 2024 Pacific Northwest Weather
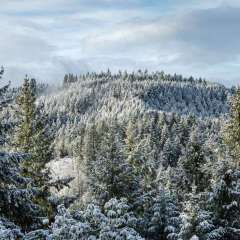
Perfect time of year. Pleasant temps and still some green on the hills.- 1
-

-
350
May 2024 Pacific Northwest Weather
Though sometimes guidance won’t catch the establishment of the ENSO/low frequency signal until it’s already establishing in real-time. So if/when it happens it’ll probably be something like that. -
350
May 2024 Pacific Northwest Weather
Zero indication of any niña cell establishing. At least as things currently stand across guidance.- 3
-

-
-

-


Recommended Posts
Join the conversation
You can post now and register later. If you have an account, sign in now to post with your account.