
June 2016 Observation and Model Discussion for the Pacific Northwest

-
Who's Online 20 Members, 3 Anonymous, 142 Guests (See full list)
-
Popular Contributors
-
1

-
2

-
3

-
4

-
5

-
-
Activity Stream
-
2867
May 2024 Pacific Northwest Weather
People on the Persian Gulf and Red Sea will have no idea of Phil’s pain. 150°F heat indexes every day -
238
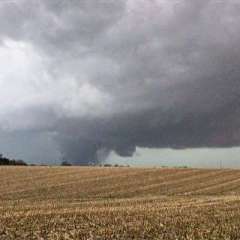
May 2024 Observations and Discussion
This tornado knocked over several wind turbines! -
2867
May 2024 Pacific Northwest Weather
Future historians will remember this as the year in which the PNW no longer had summer temps over 75 degrees. All the units will need to be shipped to DC- 2
-

-
2867
May 2024 Pacific Northwest Weather
Costco thought it was coming. They were wrong and will be stuck with these units until our next heatwave in 2028.- 1
-

-
2867
May 2024 Pacific Northwest Weather
0.16" today. Not a lot, but more than expected.- 1
-

-


Recommended Posts
Join the conversation
You can post now and register later. If you have an account, sign in now to post with your account.